I heard through the grapevine that there was a new 200 TW tire, and after doing some internet sleuthing, I met Sammy Valafar, who was instrumental in bringing the Vitour P1 tires stateside and doing the testing.
| Shortcut: go to https://vitourp1.com/ to order these tires. |
If you’re a Miata person, you might have heard of Sammy. He used to race Spec Miatas and was NASA national champion at one point. Recently he’s turned his attention towards the Optima Battery Ultimate Street Car time trials series, and autocross. The following video has some details on the test:
I asked Sammy for more information on the test, and he generously supplied me with a detailed report, spreadsheet and various conclusions. I wanted to look at the raw data myself, and so he sent me the Aim Solo data as well. What follows is a third-person look at all that data.
Testing details
- Venue: The test was performed on December 17th, 2022 in Lot 6 at Autoclub Speedway, in Fontana, California. The tires were tested back-to-back with very little time between runs. I feel pretty confident that track conditions were not a factor here.
- Vehicle: 2002 Mazda Miata making approximately 150 HP at the wheels. Xida Gen 2 single-adjustable coilovers and pillowball suspension bushings.
- Drivers: Sammy Valafar and Tommy Maresca.
- Wheels: Both sets of tires were on Konig Countergram wheels, 15×9 +35.
Tires
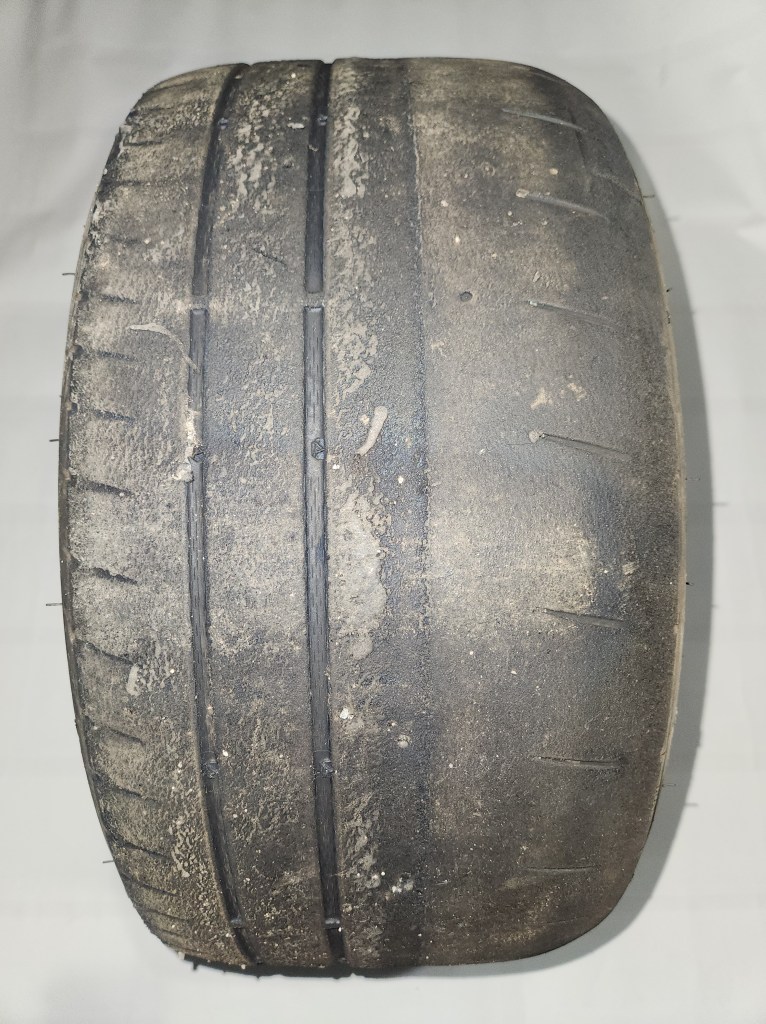
Nankang CRS 225/45R15 V1: Sammy and Tommy have both won races and championships on this tire, so they know it very well. The tire and wheel package weighed 34 lbs 13 oz.
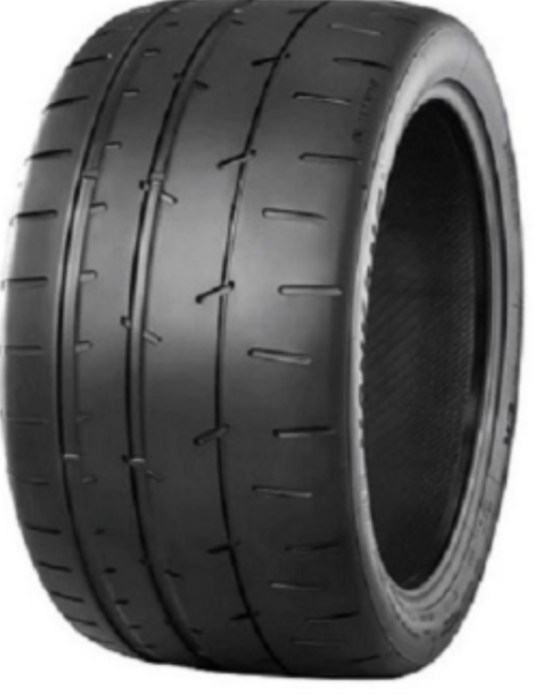 | 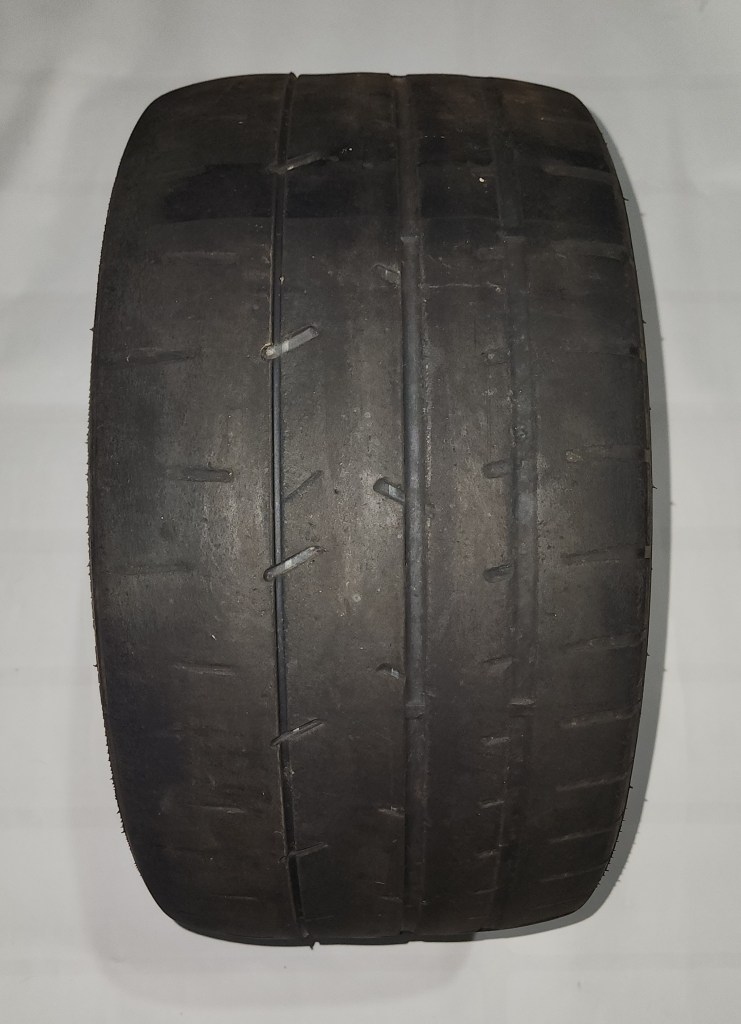 |
Vitour Tempesta P1 225/40R15: Note the shorter sidewall. Theoretically this could help with acceleration (shorter final drive) and should have less sidewall flex when cornering. At 32 lbs, 9 oz mounted up, it’s two pounds four ounces lighter than the CR-S. Wow.
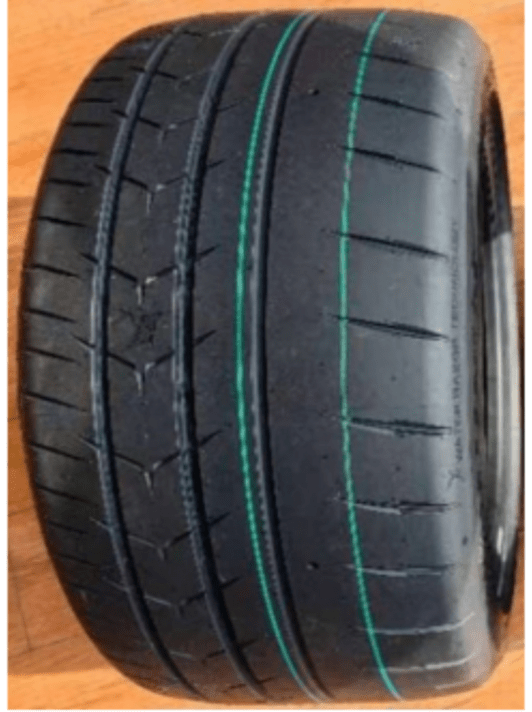 |  |
Testing data
Race Studio is great for visualizing data, but when you want to compare actual numbers, I like to use a spreadsheet. I download all the data as CSV files so I can normalize the spikes and dips in the Aim data. The spreadsheet also allows me to do math functions, which I used for the following fields.
- Peak lateral Gs – I see a lot of people citing peak lateral Gs as if it’s meaningful data, but it really isn’t. If you look at GPS data, it’s full of peaks and valleys; you might see a peak value of 1.72g followed immediately by 1.19g dip. This is clearly not what’s happening in the real world. Peak lateral Gs is only useful if there’s a smoothing function in the device or in post processing. My method of smoothing peak lateral Gs is to take the highest reported Gs that occur within a half second interval, and average them.
- Average lateral Gs – This is a better way of looking at the lateral loads on a tire. I look at where a corner begins and ends, and then average all the values in between. Because different people drive the same corner differently, I don’t use a point on track to determine where a corner begins or ends, I use when lateral Gs exceed .6 G. (I change this value depending on the track and corner, but this a good value for this autocross track.)
- Gsum – Because tires are often mixing braking or acceleration in the corner, I’ve also included a value for Gsum, which takes the absolute value of both lateral and longitudinal Gs and adds them together. This only returns a high value if the driver is blending inputs, though.
- Min corner speed – This value isn’t a great indicator of tire performance, because it has a lot to do with driving style. Personally, I carry more corner speed, whereas my brother has more of a point and shoot style. We might be the same speed on any given day, but my min speeds would be higher on the same tire, and so it’s not the most important aspect, but I included it because I see the same thing here with Sammy’s and Tommy’s driving styles.
- Average corner speed – In the same manner that I find average lateral Gs (CSV > spreadsheet), I find the average corner speed. This turned out to be pretty important.
- Straight speed – There are four straights on the course, and top speed is recorded for each.
Track and sectors
The test course has 9 turns and 4 straights for a total of 3100′ long, with a lap time under a minute. If you look at the default track map in Race Studio, it uses a 14-sector track map, which I don’t find very useful. If you divide a track into that many sectors, you can get a driving line that’s simply impossible to replicate in real life.
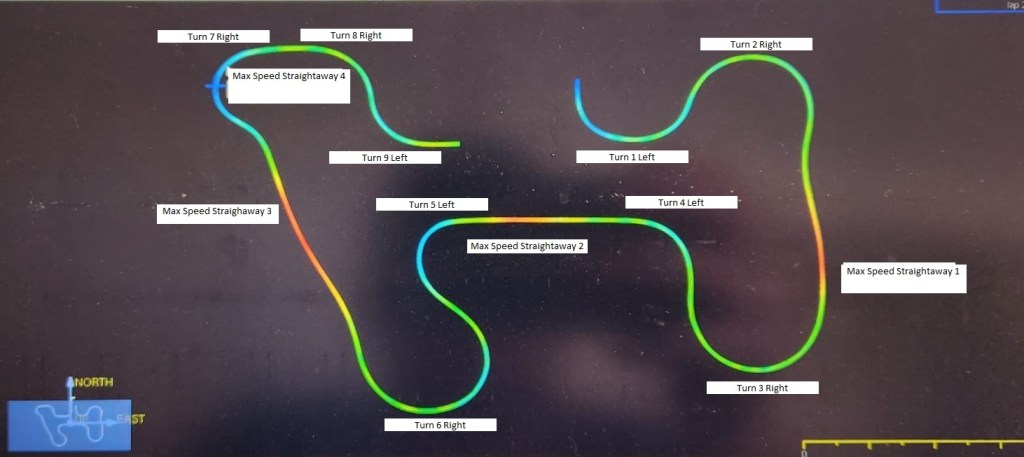
I like to look at sector times, so that I can throw out driver mistakes and calculate the theoretical best lap. So I created a custom map that divides the track into just four sectors. This is a more realistic view of what the tire and driver are capable of in an optimal lap, and a good way of organizing the report by sector.
- Sector 1 begins with a standing start, so the first left hander isn’t at full speed or full lateral Gs, and there’s more long-G acceleration in it. The left transitions immediately into a 180-degree right, followed by a short straight.
- Sector 2 is a 180-right followed by a 90-left, with a longer straight.
- Sector 3 is an over-90 left followed by an over-180 right, ending in the longest straight.
- Sector 4 starts with a kink left into two 90-rights right and a short 90-left at the end.
I color-coded the summary data to make it easier to read, but it’s still a mess of information that may give you a headache.
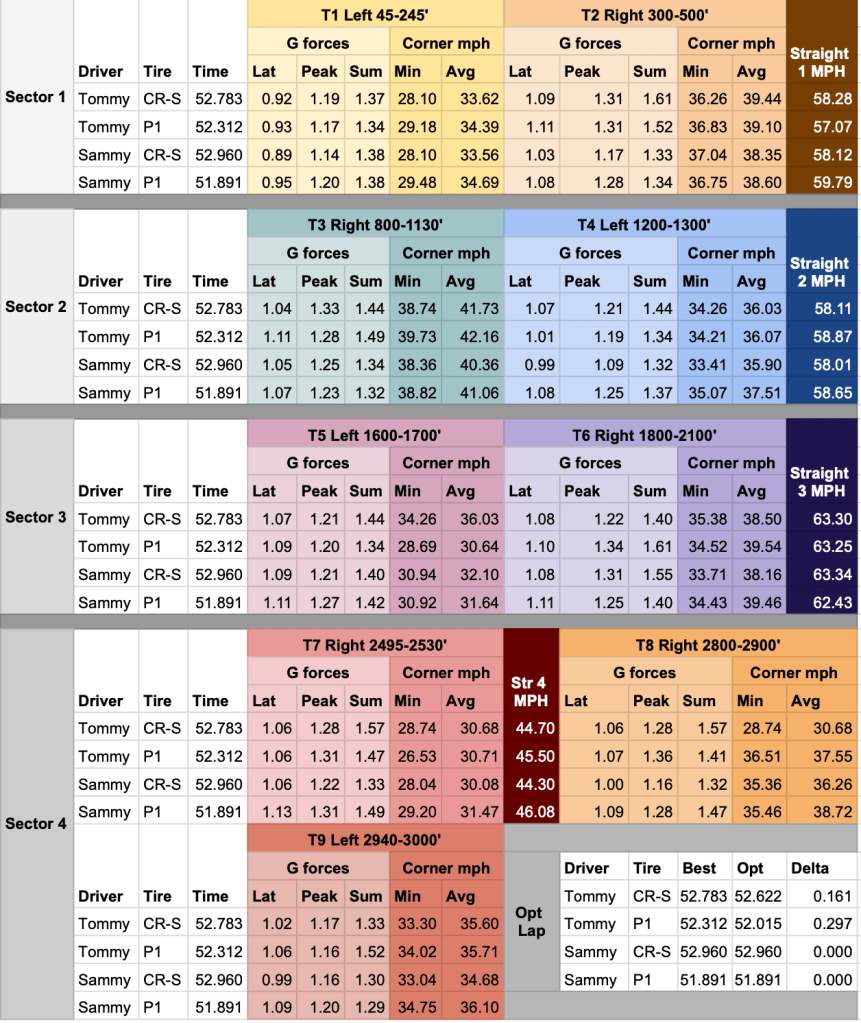
Conclusions
What we are looking at here is simply data, and what the data says is the Vitour P1 is faster than the Nankang CR-S. I’ve only shown the best laps from each driver, but each driver did four laps on each tire, and so I was able to normalize the data somewhat, and also get theoretical best laps (the Opt Lap part at the end).
What the data doesn’t capture are the nuances. Drivers may prefer one tire over another based on feel, sound, breakaway characteristics, or other variables that aren’t easily captured in GPS data. And drivers may put down more consistent times on one tire, and choose that over an outright faster time.
But however you slice it, I think the most telling factor in this tire test is that both Sammy and Tommy have lots of experience on the Nankang CRS, and have won races and championships on it. And yet they both went faster on the Vitour P1 the very first time they tried it, and they did so consistently.
Back in January 2024 when I last updated this article, there was a big hubbub about whether or not the P1 would be legal for SCCA competition. Apparently the tire was banned for not having enough sizes. I don’t race with the SCCA, so it doesn’t much matter to me. As a Miata guy, I’m glad to see Vitour offering big-boy 285 and 305 widths in 15″ wheel sizes, and it would be nice to see some other manufacturers do the same.
Update for 2025 – The tires are legal for SCCA racing, go get you some at VitourP1.com.

Anyone have any info or feedback on how either tire has done in an endurance race?
LikeLike
I don’t know of anyone using either tire for endurance racing, and I wouldn’t either. The Hankook RS4, Kumho V730, Maxxis VR1 and other similar enduro 200TW tires are what I’d use. Autocross tires are for autocross.
LikeLike
Great writeup. I have done quite a bit of testing on these myself. The gist being they provide a fast lap pace very similar to the A052 but with much better wear and heat tolerance.
There is a collection of testing data, reviews and such in this Facebook group:
https://www.facebook.com/share/KkWFez87fFguzr53/?mibextid=WC7FNe
Anyone interested in the P1, questions, inquiries, feel free to reach out:
http://vitourp1.com
LikeLike