The race is over, but we’re still living the race weekend over and over. In this installment, let’s see how the drivers did compared to each other.
Fastest laps
Alyssa made a video of each driver’s fastest laps. Let’s take a look at Alyssa first, because whe set the fastest laps of the weekend, and we’ll use her as a reference for where the rest of us can improve.
From her triple-video overlay, it looks like he’s pretty consistent. However, if you look at the Aim Solo data, her laps vary by .4 seconds above and below the reference lap. On the back straight, his top speed varies by 2.2 mph.
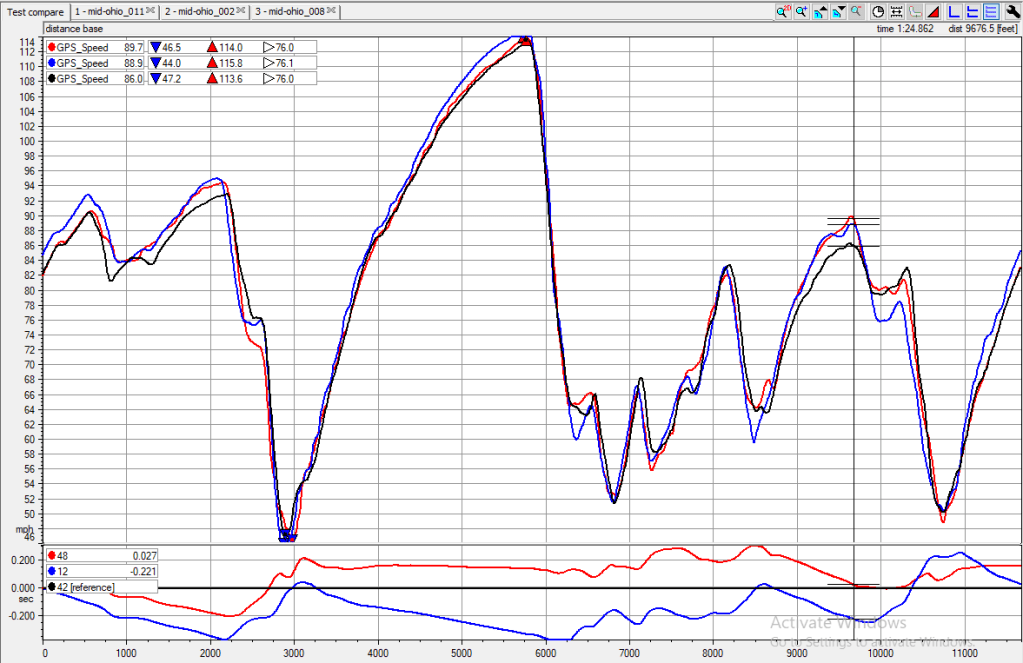
The bottom of the graph shows the time gained or lost compared to the reference lap, which is black in this case. On the lap denoted by the blue line, you can see she had .4 seconds in hand at around 2200′ again at 6000′ and .2 seconds at 9800′. As good as Alyssa was driving, it looks like she could have gone one second faster.
Team fastest laps
Alyssa also made a neat overlay with everyone’s fastest laps. Here are some things I see in the video.
- T1 – Everyone except me initiates the turn sharply, my hands are slower at first, and I must continue to steer through the corner. I’m also a chicken shit in fast corners, and I lose most of my time here.
- Keyhole – We are all very similar through this turn. If you watch other laps in our full race videos, we often take different lines, sometimes diamonding it, sometimes driving a rim shot. Oddly, it doesn’t seem to make a difference in lap time or trap speed.
- T4 – Pat and Sonny are equal through here, but Alyssa trails the brakes the best and this is where he makes up most of his time. From here on, he is GONE.
- T9 – Pat and Sonny are still dead even on the approach to the corner, but by the time they pass under the bridge, Sonny has a tenth.
- Carousel – Sonny takes a wider entry line that seems to work really well.
Team race laps
I don’t have data on Sonny’s best qualifying lap, which he set on Friday. So let’s take a look at the best race laps over the weekend. These are not the same laps as those in the video. The chart below is color-coded thusly:
- Alyssa is Green (think money) – 1:44.637
- Sonny is Orange (think 949) – 1:45.273
- Pat is blue (like his F150) – 145.355
- Mario is red (like his NA6) – 1:47.579
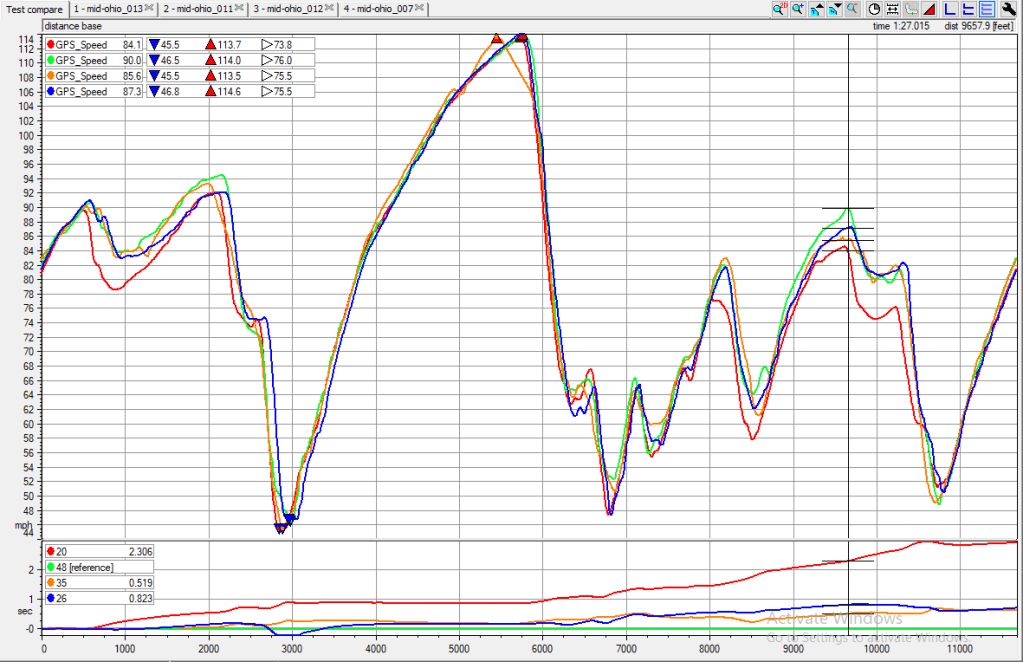
I’m no expert on analyzing data traces, but this is what I see:
- Everyone goes through T1 (1000′ mark) pretty well, except me. I decelerate too much, and this severely impacts my speed down the following straight.
- The chicane begins at the 2000′ mark, and Alyssa (green) is faster and later on the brakes than everyone, and gains time here.
- The Keyhole is at the 3000′ mark, and Pat (blue) has a higher minimum speed, but can’t get on the gas as early at the exit. In the end, we all come out of the Keyhole the same. Notice the time bar on the bottom is flat from 3000-6000′, meaning we are all going about the same speed.
- Sonny (orange) does something interesting in T4. He doesn’t gain time, but it might be a move that’s useful in traffic. Maybe he had traffic? In any case, it didn’t affect him.
- Alyssa ekes out a little bit on everyone in the esses.
- Turn 8 is at about the 8000′ mark, and it’s not really a corner, you just pin it through there. I may have experienced traffic at this point, because there’s no reason for me to slow down, and I did.
- Turn 9 is about about 8500 feet, and this is where Sonny is better than Pat. On every other corner they are pretty evenly matched. Meanwhile, Alyssa flat sails through this corner and his resulting top speed at the top of the hill is where the hash marks are. You can see the speeds in the upper left hand corner. Alyssa’s going 90 mph, which is 3-6 mph faster than the rest.
- Turn 10 is at about 10000′ feet, and everyone else goes through it really well. Except me, I park it.
- The Carrousel is like the Keyhole, we might take different lines, but everyone gets through it at about the same speed.
Lies, damn lies, and statistics
It was illuminating to look at our fastest laps, but an endurance race is won on consistency, not hero laps. Let’s crunch some numbers. Better yet, let’s get someone else to crunch the numbers. Alyssa’s partner Bethany did some statistical analysis of our race laps, and it’s so nerdy I have to share it.
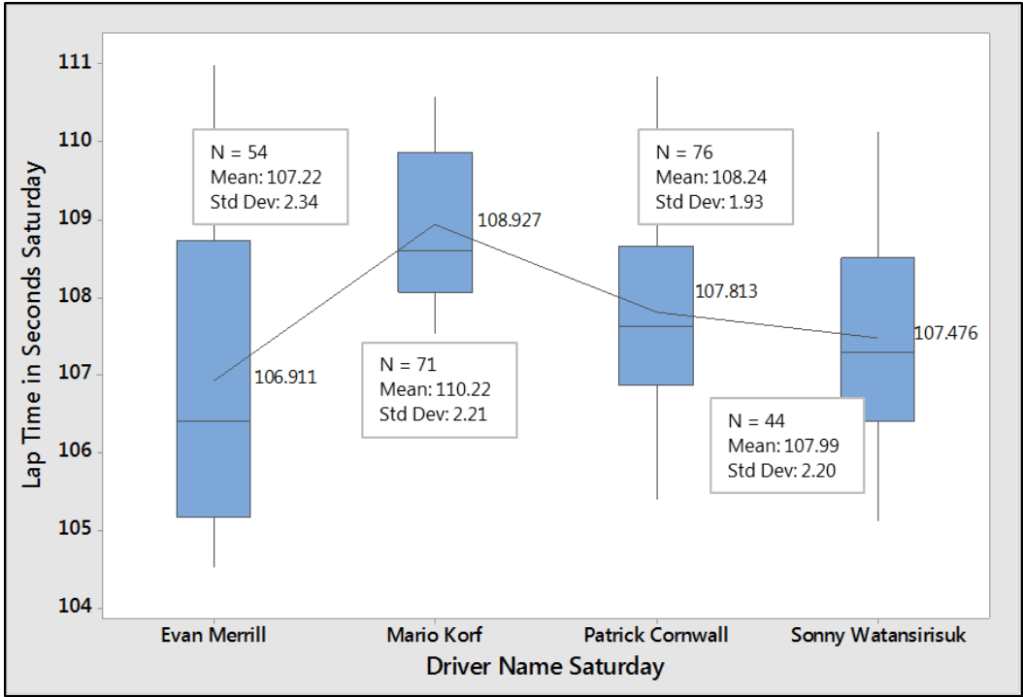
In the following box charts, the lower the box, the faster the lap, the shorter the box, the more consistent the driver. The horizontal line in each box is the median lap time. The mean (average) lap time is called out in the inset, and the horizontal line connecting the boxes is a way to visually compare that. Very slow laps (out laps, in laps) were removed from the data set.
Let’s start with Saturday. Alyssa is capable of low lap times nobody else can match. Sonny is a wee bit faster than Pat. All three of them can lap through traffic without dropping into the 1:49s, which is where most of my laps are. Our standard deviations are similar, meaning we were all driving with about the same consistency, but Pat was the most consistent on Saturday.
On Sunday the track was a bit slower, but we all drove better. Alyssa’s average lap is about the same as the day before, but look how much more consistently she’s driving. Sonny had the fastest average lap time, and he improved his consistency a bit as well. Note that we should disregard Pat’s laps, because he only did six, and hadn’t found his groove in that stint yet; he’s over a second off his normal pace.
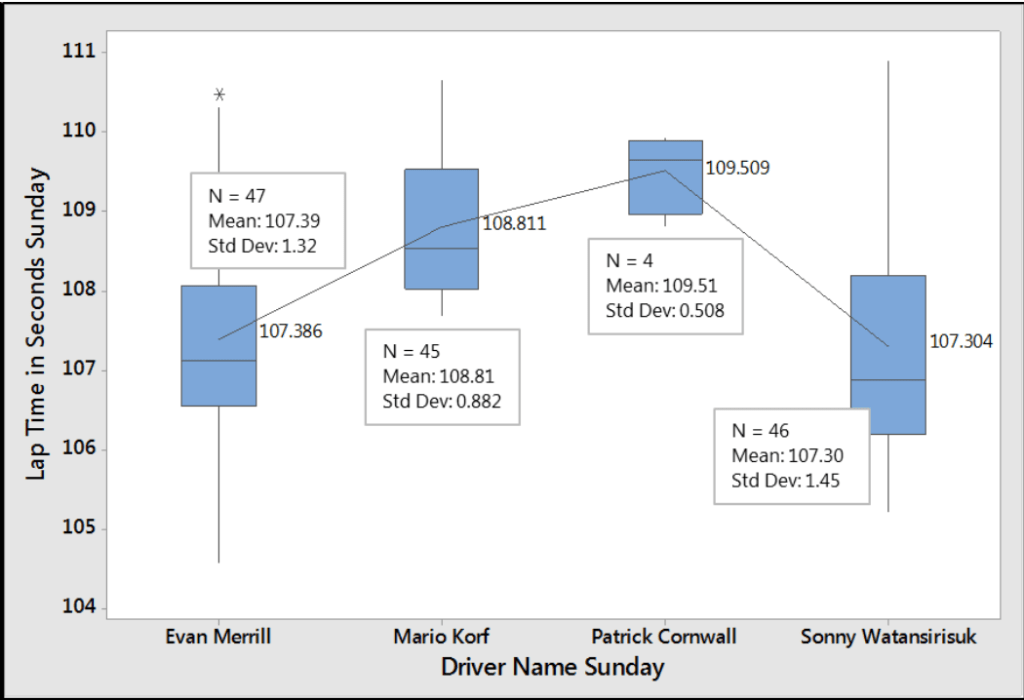
When I look at the Sunday data, I feel a lot better about my driving. Pat has raced at Mid-Ohio a couple times before, and this was my first time. On average, I’m only 6/10ths off Pat’s faster Saturday times. I can live with that.
Also on the plus side, my standard deviation says I’m the most consistent driver, by what looks like a decent margin. I think this is because I drive with more in reserve. Some examples of this from the weekend are that I avoid contact with other cars (Sonny), I don’t put four wheels in the grass (Pat), and I don’t hit tire walls (Alyssa). But let me not congratulate myself too much. As we saw in the video and Aim data, I’m driving tentatively in the fast sections.
The next chart is basically the same as before, but sorted by driver, rather than day. This chart is a good way to look at driver improvement. (Again, we should disregard Pat’s Sunday stint.)
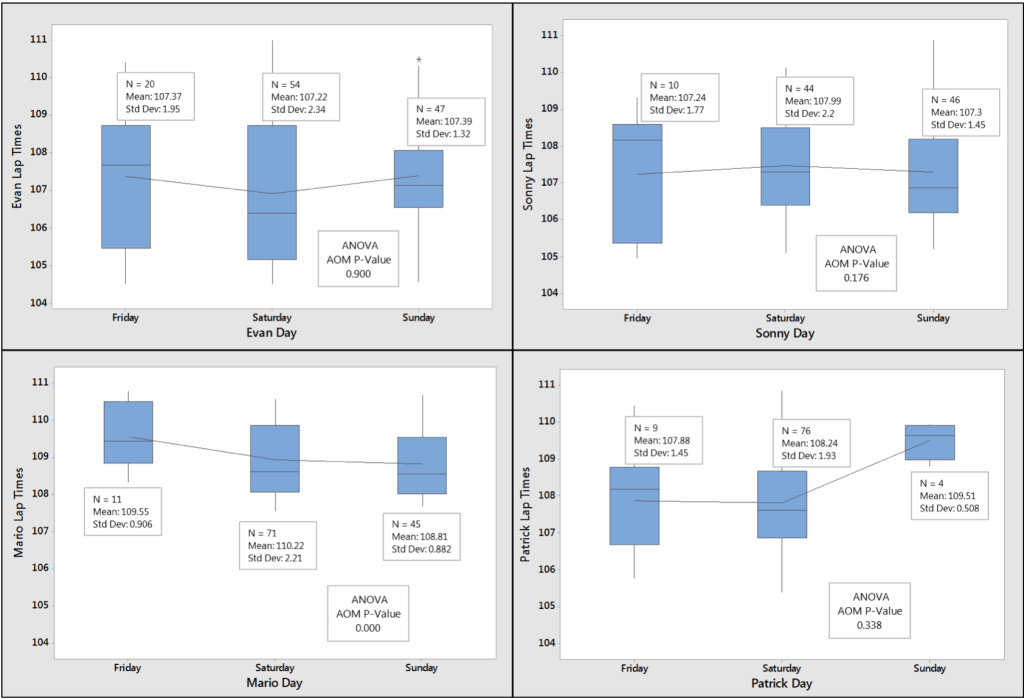
I’m told that the ANOVA p-value is a test of the difference in the mean lap time for each driver. If the p-value is less than 0.05, then there’s a statistical difference. What all this means is that I drove significantly better each day, and they didn’t. Another way to look at it is that they were all on pace rather quickly, while I took longer to learn the track.
The following histograms give another way to view the laps. Each bar represents half a second. Alyssa (blue) is other-worldly. Pat (yellow) and Sonny (green) both have a rhythm centered around 107-seconds. My Saturday is poop, but I like what I’m seeing on Sunday.
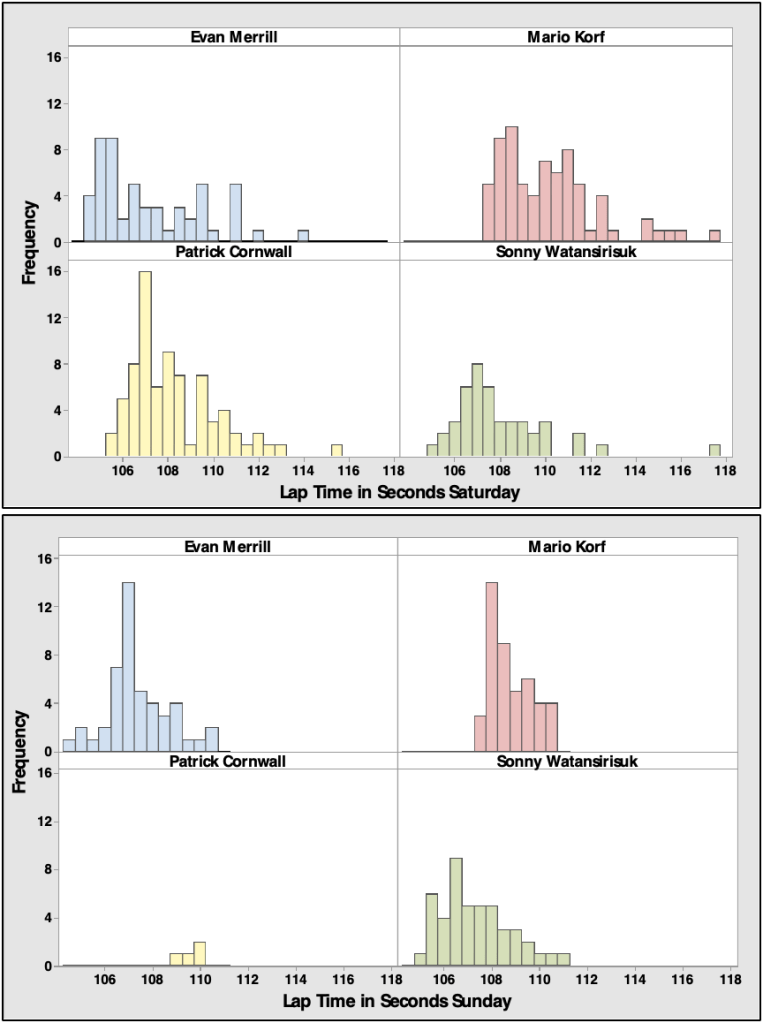
On Sunday I did a lot of 108-second laps, and all of my laps are within a narrow 3.5-second window. If you compare my Saturday to Sunday (red), it’s like two different drivers were in the car: Doctor Jekyll and Mister Consistency.
Racing incidents matter
Endurance racing isn’t just setting lap times, it’s staying out of trouble. Our average pit stop was 3 minutes and 26 seconds, but two racing incidents made them longer.
After Sonny and the BMW clashed, we lost two minutes in the pits. Most of those two minutes were because he caught us unprepared, but that’s what happens when you take an unplanned stop. We also spent some time looking over the car for damage. Those two minutes are the equivalent of adding 2.5 seconds per lap in his stint. On average lap time, this made him the slowest driver of the day on Saturday. As a side note, the impact bent the right rear wheel. That’s the wheel hub that would later break and end our weekend. We’ll never know if the impact damaged the hub and caused it to fail, but it can’t have helped.
When Alyssa hit the tire wall at pit entrance, it took us an extra minute and twenty seconds pulling the bodywork straight and checking over the car. If we add that time to Alyssa’s stint, each lap was 1.5 seconds longer. That single mistake at the very end of his stint made Alyssa the slowest average driver on Sunday (I’m not counting Pat’s handful of laps). Yes, this made Alyssa even slower than me! Racing incidents matter.
In conclusion, our two fastest drivers were also our two slowest drivers. The obvious take away here is that one should avoid contact at all costs.
Driver weight [updated 11/6/2019]
When I originally wrote this section, I compared data traces of Alyssa and I, and showed that 65 lbs was very significant for acceleration and resulting lap times. However, after going through the data some more, I think this was probably time of day. Alyssa’s first run on Sunday was cold, and the engine would have made more power. There might have also been a headwind. Whatever the case, there’s just no way 65 lbs amounted to .4 seconds on the back straight.
I then went and looked at many other runs, comparing the same driver on a full tank and then an empty tank (same stint), which is a difference of about 100 lbs. Even with that larger weight amount, it was hard to find any correlation between weight and speed on the back straight. Go figure.
OptimumLap simulation
Another way we can look at the difference weight makes is to do a simulation in OptimumLap. On the pro course (no chicane), the simulator says my car should do a 1:41.57, and I’ll add two seconds to that for the chicane, so call it 1:43.57. (Incidentally, this is the same lap time Alyssa would do if she dropped the one second we saw in the Aim data.) So then, what happens when I add 65 lbs?
| Weight | Lap |
| 125 lb driver | 1:43.57 |
| 190 lb driver | 1:43.93 |
| – difference | 0.36 |
According to the simulator, a difference of 65 lbs is worth .36 seconds. I typically trust OptimumLap, but in back-to-back tests at Pineview Run, I’ve noticed that the time difference is in OptimumLap is about half of what I’ve logged in the real world, and I would expect about .7 seconds.
So let’s split the difference and say 65 lbs is worth .65 seconds. That makes every 100 lbs = 1 second, which is a rule of thumb I’ve heard before. It may not be accurate, but it’s easy to remember.
6/10ths of a second would be a big deal at the pro level, but not at my level. I have a lot of things to work on before I start using weight as an excuse. But Pat could argue that he’d be faster than Alyssa and Sonny if they weighed the same. Start your excuses Pat!

How do you filter out outliers such as long yellow sessions or even full course yellow? Do you say anything over a specific time is garbage time?
LikeLike
Our statistician removed anything over 114 seconds from the box charts. Those laps are still in the histograms, though. We had no full course yellows the entire weekend.
LikeLike