Developing a vMin Table for Data Coaching at Watkins Glen

TL;DR: A long story on how I got started with data, became frustrated with data coaching, and developed a simple tool for self coaching. You can skip this epic tale and print the PDF of the Watkins Glen vMin table.

I’ve been a data coach for a few years, and everyone I’ve coached has made massive improvements. Most of the time data coaching takes just one or two sessions, and on average, I’d say people go about a second faster per mile.

On a short track like Pineview, that’s only one second, but at Watkins Glen, that’s three seconds. Three seconds is like going from a track tire to a slick. Or adding aero. Or buying a lot of horsepower. Any of those things could cost $2000 or more, and so getting three seconds for free is phenomenal. Yes, free.

For a couple years I was the lead data coach for the Niagara Region Porsche Club of America (NRPCA), and we offered free data coaching. While PCA clientelle can certainly afford paying for it, we were trying to lower the bar and get more students interested. Nevertheless, I’d have only one or two students per day.

This became a discouraging waste of time, and so last year I took a hiatus from data coaching. I’ll get back to that again, but in the meantime, I want to share something I invented, which is a vMin table for self-coaching. It looks very simple, but there’s a lot of research and effort that went into it.

It’s a long sorry, hence the TL;DR at the top. I won’t blame anybody for simply clicking the link and moving onto using the tool. But for those that want the backstory, it begins like this:

I never wanted to use data

14-odd years ago I did one or two HPDEs with Hooked on Driving in California, and after seeing a shit-heap of a car on its way to race at Chuckwalla, I convinced my brother and a couple friends to buy a first-gen MR2, cage it, and race it in the 24 Hours of Lemons. For several years, everything I knew about performance driving I learned with the bit between my teeth, going wheel to wheel in an underpowered car, trying to catch faster cars in the corners.

I was good, always setting the fastest times on my team. When we acquired Ben Dawson (Dominating with Dawson, on Garage Heroes in Training), I was able to match his times, but not better them. Then my identical twin brother became a real student of the game, reading Speed Secrets, getting into data, sim racing, instructing… and he left me in the dust.

After being the fastest on the team for a couple years, I was now a few seconds slower per lap. Ian encouraged me to follow in his footsteps, but I countered that I wanted my skills to represent the everyman driver. It could maybe turn into a twin study, where one brother used data, the other didn’t, and look where they ended up years later.

That’s how much I didn’t want to use data; I was willing to let my identical twin trounce me on track, handicap our team’s position in the final standings, pretend to do a bogus twin study, and skill-shame myself with a milquetoast modifier like everyman.

(When reading this article to my wife, she said if people only knew how competitive I am, the fact that I would let my twin brother beat me is incomprehensible. This is the exclamation point on how much I didn’t want to get into data.)

The transition to using data happened sometime after leaving California and starting a new team in New York. Ian flew out a couple times to race my new Miata, and he’d annoyingly show up to some unseen track, and destroy the team’s best times in his first few sighting laps.

It took a while, but the everyman got tired of his everyday beatings, learned how to use data, and then began to coach others through the same process. The track to hell is paved with good intentions.

Data coaching barriers

Data coaching hasn’t taken off for me like I had imagined it would. The reason for that isn’t a hardware problem, since I bring six Aim Solos and assorted brackets with me to all events. Neither was it a financial hardship, because I offered it for free. And nobody ever lost a driving session, since I’d schedule their coaching sessions around that. There were literally no barriers to data coaching, and so the reluctance was puzzling.

Part of the reason data coaching didn’t catch on was due to PCA itself being different from other clubs: we weren’t supposed to talk about lap times, none of the senior instructors were using data or pushing it into the curriculum, much of the clientele were older and skeptical of things new, and in any national organization, change moves at a snail’s pace.

There’s also the “I’m just here to have fun” contingent that comprises most of the people that sign up for a HPDE, and I totally get this group. If I went to a pickup basketball game and some “coach” was on the sidelines saying he could run me through drills between games, I’d walk the other way. The fact is, most of us sign up for track days to have fun with friends, and while the E in HPDE stands for Education, we are really there for the E in Enjoyment.

However, what I’ve found through years of trying to get people to dip their toe into data, the largest barrier to data coaching is this: nobody wants to know they are slow. And they don’t want anyone else to know that either. Pride is the wall that stands between having fun and and going faster.

The real barrier to data coaching.

The thing is, I haven’t met any slow drivers. Everyone has at least one corner where they are fast, and we all have one or two corners where we are slow. You use the former to build on the latter. And that’s what data coaching does – it finds your strengths and creates an individualized strategy to address your weakness. People call it driver mod and it’s a good term, because it’s something you take to every car you drive.

But because pride is more delicate than money is valuable, people will spend thousands on car mods and won’t accept a free driver mod. This was doubly frustrating because NRPCA HPDEs are mostly on weekdays, and so I was burning vacation time to help one or two students per day. So I pondered the incredible value of data coaching, against the struggle of getting people to try it, and I realized this: people will only try data coaching if they can do it in private.

Technological barriers

I wasn’t the only one who figured this out, Garmin did, too. Their Catalyst product combines AI coaching with data privacy in a compact package that doesn’t require a laptop or a professional to review the data.

I read the Garmin Catalyst review by Mark Petronis at AMT Motorsport, and that should have deterred me from buying one, because I’m already an advanced data user. But a virulent case of FOMO swayed me into buying one and experimenting with it for a couple months. I found the following shortcomings.

  • The Catalyst doesn’t actually know where you should brake, turn in, accelerate, or track out. It only knows what you’ve already done. so you’ll never know the fastest way around the track, just the least-worst that you’ve done so far.
  • If you drive consistently, the Catalyst won’t help; without variation, it returns nothing. You need to make errors in your driving that end up being beneficial mistakes.
  • The Catalyst uses only your recent driving. There’s no way to save and then upload best laps from yourself or other drivers to compare with. And so if you live for comparative data (driver mod, tire testing, aero testing, etc), you can’t A/B test jack shit versus shit jack.
  • You also can’t download your Catalyst data and then compare it with other people using different devices. This is infuriating, because the Catalyst is gathering GPS data. All I need is a CSV file so I can dump that into Race Studio, but Garmin refuses to play well with others.
  • The coaching “opportunities” were mostly good, but occasionally had advice I disagreed with, or missed some obvious wins. For examples of that, see Gregg Vandivert’s article When Garmin Catalyst leaves time on the table.
  • The audio hints are fun and come at a good cadence, but the advice has nothing to do with skill, just to drive with more gusto. As useless as the advice was, some of it remains memorable; I can still hear her say “keep pushing,” but it’s mostly her accent, and no longer in the context of driving.
  • The Catalyst isn’t plugged into the OBD2 port, so it doesn’t know the most basic information, like whether you had pulled your foot off the gas, braked lightly, or balked a shift. It doesn’t know what gear you’re in, so it can’t whisper “hey there big guy, don’t downshift before the next left, hold 4th gear.”
  • There are numerous other quirks or strategic decisions that are baked into the firmware or blocked from export, and I simply don’t agree with a closed system that reeks of rotten Apple products.

In the end, I discovered what the Catalyst is: an excellent delta timer and video camera. [sigh] Perhaps there have been updates that address these issues, and maybe I wasn’t using mine in a way that got the best use out of it. In any case, I sold mine and haven’t looked back. But if Garmin could export the optimal lap video as 10hz GPS data, I’d buy it back at twice the cost.

My requirements must not represent the majority, as I see a lot of Catalysts at the track. However, it appears that most of them are being used as a lap timer and video camera. I rarely see people removing the devices from their cars in between sessions, and so I doubt they are using the coaching opportunities during the day. I guess this is like buying a gym membership and then only using the sauna, but least they are in the right area for self betterment. I understand many people really like their Catalyst, but those people probably never had real data coaching, and accept the shortcomings as a tradeoff for a great UX and data privacy.

On the technological flip side you have Aim products, which sets the gold standard for motorsports data loggers. Unlike the Catalyst, you can plug an Aim SoloDL into your car’s OBD2 port and/or jump into the CAN bus and get brake pressure, throttle position, steering angle, and anything else the car reports on. The amount of data is staggering, and Aim’s decision to display everything by default (including useless data like the device’s internal battery voltage), is complicated and off-putting.

But the true barrier to using Aim products is the software. I’ve worked in software development for 25 years, for companies like Oracle, Salesforce, and Google. I know what good usability looks like, and the amount of effort it takes to take a very powerful tool and make it easy to use.

The Race Studio 3 user interface is a cornucopia of poor decisions, many of which could have been fixed using setup wizards to create custom profiles. Or hire a technical writer like myself to explain how to use three lefts to make a right. But there’s nothing intuitive, streamlined, or adequately documented in Race Studio 3, and so I use Race Studio 2 most of the time, which also isn’t great, but sucks less.

It’s also worth mentioning that unless you put a password on your Solo2, your data isn’t private. When I turn on my laptop in the Watkins Glen garage, I can walk around and pick up everyone’s Solo2 on the wireless network. Because the Solo2 is so damn confusing, most people are using it only as a lap timer, and so they haven’t set a password, and everyone within earshot can access that data.

At this point of the story we come to the realization that technology sucks, and that the best tool for introducing people to data doesn’t exist. If I wanted to get people to dip their toe into the waters of data coaching, I’d need to invent something with the following qualifications: free, private, and devoid of all technology.

[vMin table entered the chat.]

vMin data coaching

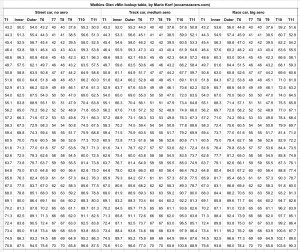
The intro to data coaching tool I came up with is simply a table for minimum corner speed, or as data coaches call it, vMin. Every track has thousands of laps of historical data, and my approach takes advantage of that knowledge, using the best drivers. The primary use of this table is for identifying which corners you need to work on. I’ll show you how to use the table in a minute, but first I want to explain why vMin.

vMin is only a single piece of data, so is it really that important? Well, after seven-and-a-half years of weekly email tips and tricks, Ross Bentley thought so. The final Speed Secrets Weekly #400 could have ended on any subject, but there’s a reason he chose vMin; it’s the thing that separates average drivers from great drivers.

Unlike lap times, which can be bought, setting an ideal vMin is 100% skill. It’s the one variable you can look at that separates the wheat from the chaff. It’s like a unique identifier for expertise, or a genetic marker for driving greatness. Here’s why:

Average drivers throw away entry speed without a thought, and that’s because their thoughts are on two things they learned in the novice group: late braking and early acceleration. When you’re adept at those skills, and combine that with a modern car’s nannies and horsepower, you can pass everyone in your DE group. Advancing to the fastest run group and passing the instructors is simply a matter of more power and better tires.

On the other hand, advanced drivers hoard entry speed like a dragon with its gold; they save it and defend it. Having already mastered late braking and early acceleration, they can instead concentrate 90% of their attention on the last 10% of corner entry. In that very small and compressed zone just before the apex, they make micro adjustments in a delicate dance that maximizes traction, minimizes steering angle, and positions the car for the optimal exit. And they do all of that while retaining the highest minimum corner speed. Herein lies the real art of driving, and if you want just one metric that separates the artistes from the poseurs, you can see it in a single number: vMin.

Another great thing about vMin analysis is that you can still get data in a DE session that’s full of traffic. Unlike looking at lap times, which can be spoiled by a single slow driver, you only need to hit each corner once perfectly, and you’ll have representative vMin data. Of course the more laps you do the more accurate your data is, but the point is, you don’t need to be enraged by backmarkers spoiling a lap, you can still get good data on a crowded day.

Data coaches may add the fact that while vMin is an important metric, where the car is at the point of vMin, and what direction it’s pointing, are actually more important. Yes, I agree wholeheartedly. But if you are able to get that kind of information, then you’re already using data, and this vMin table was not invented nor intended for you! But I will also say that that the where and what direction are already subtly baked into those numbers.

But let’s get back to vMin simply as a number, and not as a position or angle. By raising your vMin speed, you have an advantage until the next corner. For example, at Watkins Glen, let’s say you typically go through Turn 1 at 64 mph. If you can roll another 1 mph through the corner using a different line or technique, that might be worth a full second by the time you reach the bus stop.

Is a higher vMin always better? No. If going through the corner at 66 mph means you’re later to full throttle, then you might be a full second slower by the time you get to the bus stop. So the point isn’t to get the highest vMin in each corner, but the appropriate vMin. If your vMin is at the appropriate speed, and if you’re also at the correct location and angle, and you do this through every corner, this shows up as horizontal line in the vMin table.

Before I explain how to use the vMin table, you should know it’s a coarse measurement, and it’s not perfect. Necessarily so. Later in this article I go into how I created this table, and some decisions I made for ease of use over accuracy. The purpose of the vMin table is to give the everyman a free, private tool they can use to data coach themselves with nothing more than pencil and paper.

Using the vMin table

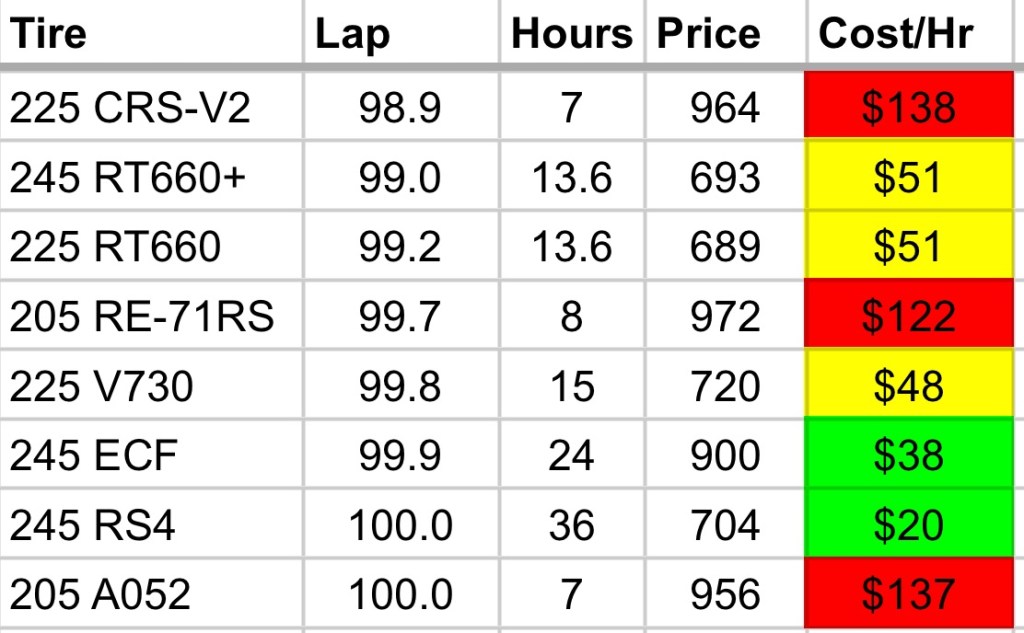
The vMin table (download PDF) shows the ideal minimum corner speeds at Watkins Glen International. It is divided into three columns, based on how much aero your car has. Circle your vMins in each corner, and they should (ideally) form a horizontal line across one or two rows. Speeds that are above that line (slower) are corners where you can increase your vMin. Speeds that are below (faster), indicate that you are either late to full throttle, or can bring several vMins higher. 

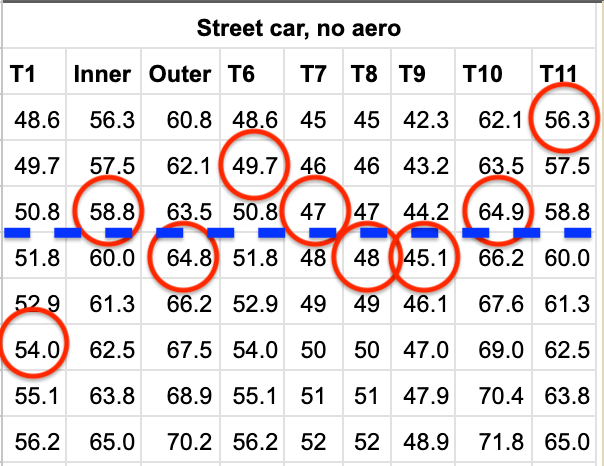
In the previous image, there’s a horizontal-ish line formed by the inner and outer loop, and turns 7, 8, 9, and 10. But T6 and especially T11 are slower, and are areas for improvement. T1 is faster than other corners, meaning the driver is either late to full throttle, or all corners could be faster. 

And that’s basically it. Draw circles around your vMins, look at the ones above and below the line, and try different strategies so that you end up with a horizontal line.

You probably noticed that there are no vMins for Turns 2-3 (the esses). That’s because low-powered cars can’t reach a high enough speed before these corners. If you’re flat footed before, during, and after the corner, it’s really just a straight, isn’t it? For the same reason, if you’re in a slow car, your vMin data for T10 could be off, because you may not reach the T10 vMin on the straight between T9 and T10.

Those caveats aside, one of the great things about vMin analysis is that it doesn’t matter if it’s raining out. All your vMins will come down by the same amount. For that matter, tires don’t matter. If you’re on all-season tires or racing slicks, your vMins should still form a horizontal line.

The vMin table can also be used as a comparative metric with other cars or drivers. If you and a buddy have similar aero (more on this later), you can compare vMins. You may find one of you has a corner you need to work on, and the other has the answer. No data coaches needed, just share driving notes with friends.

Improving your vMins

You’ve circled your vMins on the table, and it’s time to address the outliers. Most of the time you’ll be working on raising your vMins, and so I’ve included various strategies for that below. I can’t take credit for these, it’s things I’ve learned standing on the shoulders of giants. Certainly much comes from Ross Bentley, and his excellent Masterclass online webinars and Speed Secrets books, emails, and other content. I also compare notes with other coaches, and so if you have a method for raising or refining vMin, please contact me and I’ll update the list.

What I’ve found is the best way to raise vMin is deprogramming. We need to challenge our beliefs, break old habits, and even unlearn things we were taught as novices. These are things that we rely on for speed and safety, and they are deeply ingrained. But they are also holding us back. Deprogramming requires a change of focus and a deliberate (sometimes diametrical) change in our actions. By completely changing what you were concentrating on and performing through habit, and intentionally moving that focus and doing something else, you’ll begin to deprogram yourself.

Try to change your focus and actions in the following areas, and see how it changes your vMin.

Existing focusFocus on this to raise vMin
Beginning of braking point End of braking point
Late brakingBrake earlier/lighter/longer
Threshold brakingRelease longer, softer
Downshifting before the corner Hold a taller gear
Driving a late apex line Take a late apex as early as you can
Always on one pedalCoast/pause mid-corner
Early accelerationMaintain momentum
Setting a fast lapLearning
DrivingDrilling

Note that different corners will require different strategies, and not all of them will work out. People are different, too. You may find that one strategy works for you, while someone else may have a very difficult time with it. For example, I find that the best way to improve my vMins is doing the no-brakes drill, and that may not be practical for most people who are sharing a crowded track with others.

I’ll explain each of the focus areas, so you understand why they can increase your vMin.

  • BoB vs EoB – Most of us have a solid reference for the beginning of braking point (BoB). At Watkins Glen, it’s usually something very obvious, like the 400 board in T1. I’m not suggesting you stop using that, but add a second reference point for the end of braking (EoB) point. It’s deeper than you think, near the apex. By shifting your focus to EoB, you’ll spend less attention on late braking and more on that crucial zone, where the wild things are.
  • Brake lighter – For someone who is really good at late braking, it may seem that breaking earlier, lighter, and longer will result in a slower lap time. However, some combination of earlier, lighter, longer will set you up for a higher vMin, and with that, your lap time will come down. You may eventually get back to later, stronger, shorter, but only after you understand the true vMin in that corner, and position your car appropriately.
  • Release softer – It’s easy and fun to pass people on the brakes. Drop anchor a fraction of a second later, brake hard in a straight line, and turn in at the last possible moment and you’ve made a great pass. But once the pass is complete, it requires a lot of effort to turn the car sharply at a low speed. If you release the brakes softer (earlier and longer), you can add a little bit of steering into the final part of the braking zone, making the car a wee bit less stable. This will allow you to pivot the car using yaw instead of steering angle, which results in earlier and acceleration and less tire scrub.
  • Hold a taller gear -Because the engine has better acceleration at higher revs, most people downshift before the corner. Instead, try holding a taller gear. By not downshifting, you can use all of you concentration on corner entry. By using a taller gear, you can apply full throttle earlier; it’s like a passive traction control system. If there’s just one exercise you try, I hope it’s this one, you may be surprised by the results. If this doesn’t work, then your car may have large gaps in the gearing, and so try downshifting after the corner. This will still free up your concentration on corner entry, while providing more oomph at corner exit. My twin brother has been trying go under 1:02 sim racing a Miata at Brands Hatch Indy, and was stuck there for years. He changed his shifting to after the corner, and can now consistently click off high 1:01 laps.
  • Apex earlier – You were taught a late apex line for good reasons, it allows a larger corner radius, earlier acceleration, and it’s safe. Do what you’re doing now, just do it earlier. We call this backing up the corner, and it’s one of the things I look for immediately when data coaching. Whenever I compare two or more drivers, whoever has their vMin further to the left will be the fastest, because they broke earlier, turned the car earlier, and got on the gas earlier. Another reason you should apex earlier is because not all corners require a late apex. But most of us learned the late apex line early in our driving careers, and because it’s so effective, we’ve programmed ourselves to use that strategy in all corners. This is the most common mistake I see as a data coach, but unlearning the school line requires a deliberate change of focus.
  • Coast – Whether or not they’ve heard “always be on one pedal,” many people are. They transition immediately from hard on the brakes to hard on the gas. The term is pedal mashing; the definition is slow. You’ve probably seen a friction circle, and understand that if you use 50% of the tire’s traction for braking or acceleration, you only have 50% left for cornering. The result of immediately jumping from the brakes to the gas means the car never experiences 100% of the tire’s grip for cornering. However, if you allow the car to settle in the middle of the corner, then it can use all of the the available traction for lateral grip. We aren’t talking a lot of time spent coasting, it could be just a couple heartbeats between the pedals, but it can pay huge dividends in vMin. If you’re a pedal masher, it may take some effort to delay your transition from brakes to throttle, but try coasting for a full second mid corner, watch your vMins go up, and your lap times come down.
  • Conserve momentum – Drive a Miata. No, seriously! Every car is a momentum car, and if you can’t go fast with 90 hp, 900 hp isn’t going to help you. The only way to go fast in a slow car is to conserve momentum, and the best way to learn that is in a Miata. If you can’t borrow or rent one, drive your car two gears taller than normal. It’s probably still faster than a Miata, but you’ll get the point of the exercise.
  • Focus on learning – Lap times are an important measurement of self worth, and at some point during a weekend most of us are focused on setting a PB lap. But you only need one, and it’s usually set around 10-11am. So for the afternoon sessions, change your focus to learning, and experiment with things that can raise vMin. You will go slower than normal, but your next morning session will thank you. Also, if you drive a modern car with traction- and stability-control systems, turn off all the nannies, even if it’s raining. Heck, especially if it’s raining. Those things may help you set a fast lap right now, but they are seriously holding you back in the future. In my car, the difference between letting the car’s computer think for me and me thinking for myself is about 1.5 seconds per lap, and that’s on a short 1-mile course.
  • Drills – It’s difficult to learn how to play a musical instrument without doing scales or other repetitive exercises. And when you want to learn how to play a song, you need to break it down into multiple pieces and do each piece separately for a while. That’s drilling and it’s an essential part of mastering anything. How much drilling do we do at the track? None. Part of that is because drilling isn’t fun, but it’s also both unsafe and rude to do drills when sharing the track with people who are mostly trying to set PBs. The answer is to use your warm up and cool down laps for drills. But if you want real mastery, you should spend more time drilling than driving, and that requires a mostly vacant track. For this I suggest either becoming a member at a private club like Pineview Run or Circuit Florida, or hitting a less popular track mid-week. I won’t go heavy into which drills you should do, but the no-brakes drill, followed by no shifting, is a good one-two punch that will raise your vMin and drop seconds per lap.

Now that I’ve addressed your low vMins, what about those corners that have a vMin that’s faster than others? These are both rarer and easier to solve. Like in golf, most of us are trying to correct a slice (low vMin), but the odd duck has a hook (high vMin).

If you have one vMin that’s too high, you might be a novice that’s under-driving the whole track. That’s OK, this gives us something to work with! The confidence and skill you’re experiencing in that one faster corner can be applied to every other corner, and all your vMins can come up. Ask you instructor to help you with this, you’re about to drop 5 seconds per lap!

If you’re an intermediate or better driver with one vMin that’s too high, then you’re getting on the gas too late. Review your data in this corner and you’ll see you are either late to full throttle, or rolling off after an initial throttle application, and then reapplying throttle at corner exit. On some corners, this is an appropriate strategy, but Watkins Glen doesn’t have a turn like that.

The reason for your high vMin is likely one of two things. Either you started tracking in a low powered car, in which case your natural default is to conserve momentum, or you simply charged in too fast. Good for you, because too much is easier to fix than not enough! Change your focus to braking and turning earlier (backing up the corner), and get to full throttle before the apex. You may eventually move your acceleration point a bit later, and dial in some maintenance throttle, but to break old habits you need to do something extreme, and changing your inputs such that you can apply full throttle before the apex should do it.

Using the vMin table as a shortcut in data coaching

You’ll recall that the purpose of the vMin table was to allow people to keep their data private and coach themselves. What I didn’t expect was that I’d also use this table with every single student I coached at Watkins Glen.

Before I had the vMin table, my normal process was to send a student out for two sessions with the Aim Solo. The first session was mostly to make sure the unit was working and to warm up the driver, but sometimes there are good corners or sectors that are worth saving. The second session is usually the fastest of the day, and I bring them in after that and download the Aim data into Race Studio.

I’d load up their best three or four laps, and look at the the shape of the speed trace. From that I can get just about every input they are doing, and so I don’t need things like steering angle, brake pressure, throttle position, etc. I’ll also look at the time slip on the bottom to look for any large gains due to beneficial mistakes. Next I’ll do a sector time analysis to calculate a realistic theoretical best lap, and expand the histograms to show them how consistent they are. I may then open the friction circle to show the student how they are blending inputs (there’s often a discrepancy in left and right turns), although I could already suss that out myself from looking at the speed trace.

Now that is a pretty long and complicated process, but it’s also very accurate and illuminating. But what I found was that it wasn’t necessary with the average student. Most people have the same things to work on, and it’s easy to grab the low hanging fruit. The largest, lowest, and juiciest fruit is vMin.

These days my process has changed, and after downloading their data into Race Studio, I load up all the laps (not just the fast ones), take a note of the vMins in each corner, and circle them on the vMin table. This allows me to immediately assess the general skill level of the student, and which corners they need to work on.

For example, if I see that T7 and T8 are off by say 2-3 mph, I know the student has some work to do in general. But if those corners are the same, then I can assume a higher level of skill. There are other shortcuts you may discover for yourself, so if you’re a data coach at Watkins Glen, try my vMin table and see if it speeds up your data coaching process as well.

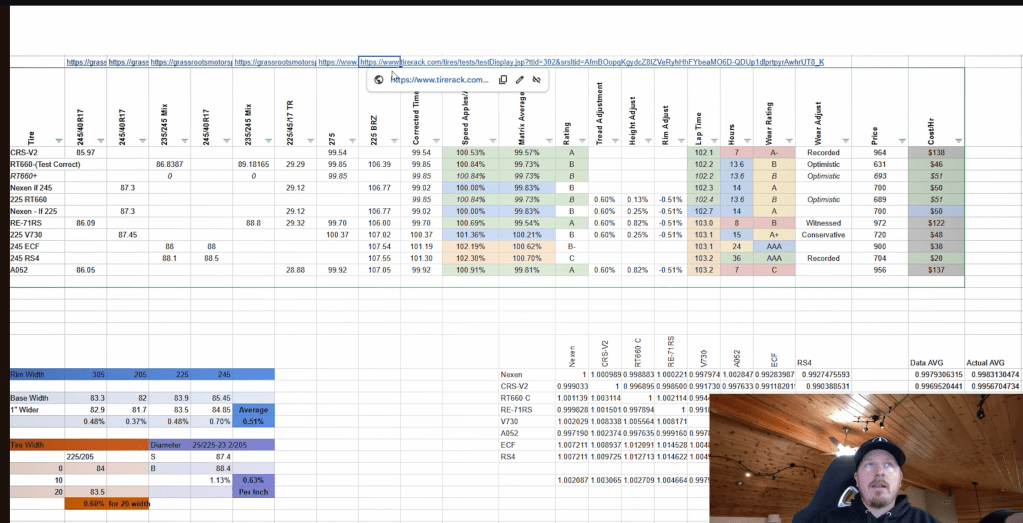
How I created the vMin table

You might be wondering where the data comes from, and how accurate the vMins are. I started by analyzing hundreds of laps at WGI, from rookie drivers to pro racers. I found a lot of 10hz GPS data online, and so it was easy to import a .drk file or convert a CSV from some other system, and then analyze the data in Race Studio.

But when I didn’t find enough pro-level data, I found another way, which was to watch in-car videos on YouTube, and simply jot down the vMins in each corner. It’s definitely a longer and less accurate process, as I needed to watch multiple laps and get the highest vMins in each corner. Data was useless at less than 10 hz, but I found some quality videos online, and it’s worth mentioning the Catalyst videos were excellent. (However, most of the Catalyst users aren’t at a level where their data was super useful.) By combining GPS data with videos I was able to get an expert-level dataset large enough to work with.

After acquiring that mountain of data, I noticed that most advanced drivers go through turns 7 and 8 at the same speed. Drivers of less skill might go through T7 a couple mph faster, or it could be T8, but the best drivers were just about the same speed through both corners.

That got me to thinking of these two corners as a base corner speed, and that every other corner was simply some multiple of the average of T7 and T8. But after some pondering, I realized it wasn’t the average of the corners that mattered, it was the higher of the two. Because the best drivers went through both corners at the same speed, everyone else should be able to as well.

I then looked at my consistent drivers, meaning those who drove T7 and T8 the same-ish speed, and jotted down what their vMin was in every other corner. Then I made that into a percentage of the base corner speed. For example, I found that an expert driver usually goes through T1 at 108% of the base corner speed (the higher of T7 and T8).

Now that I had multipliers on the base speed for every corner on the track, I could make a table for every 1 mph interval of the base corner speed. If you look at the table, you’ll notice turns 7 and 8 are always whole numbers, while every other turn is a decimal value. Now you know why.

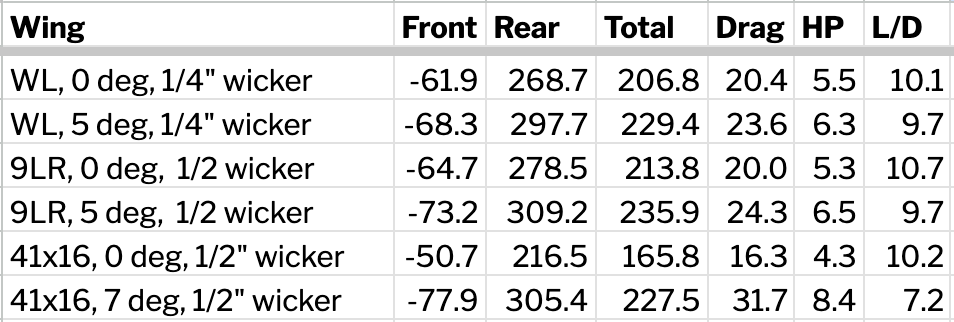
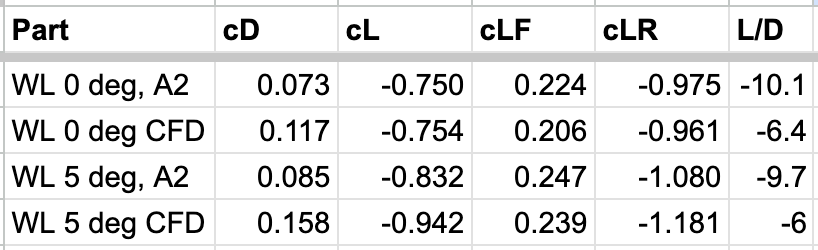
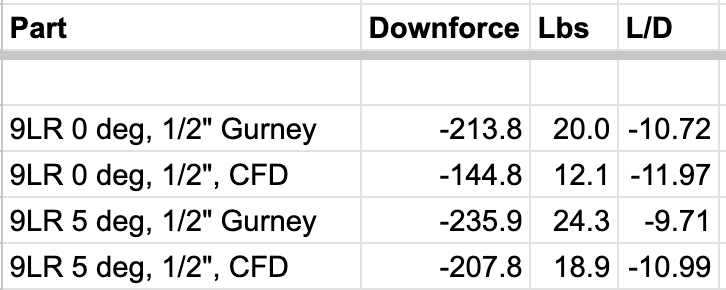
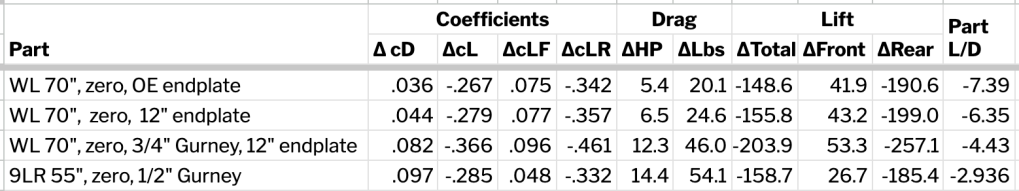
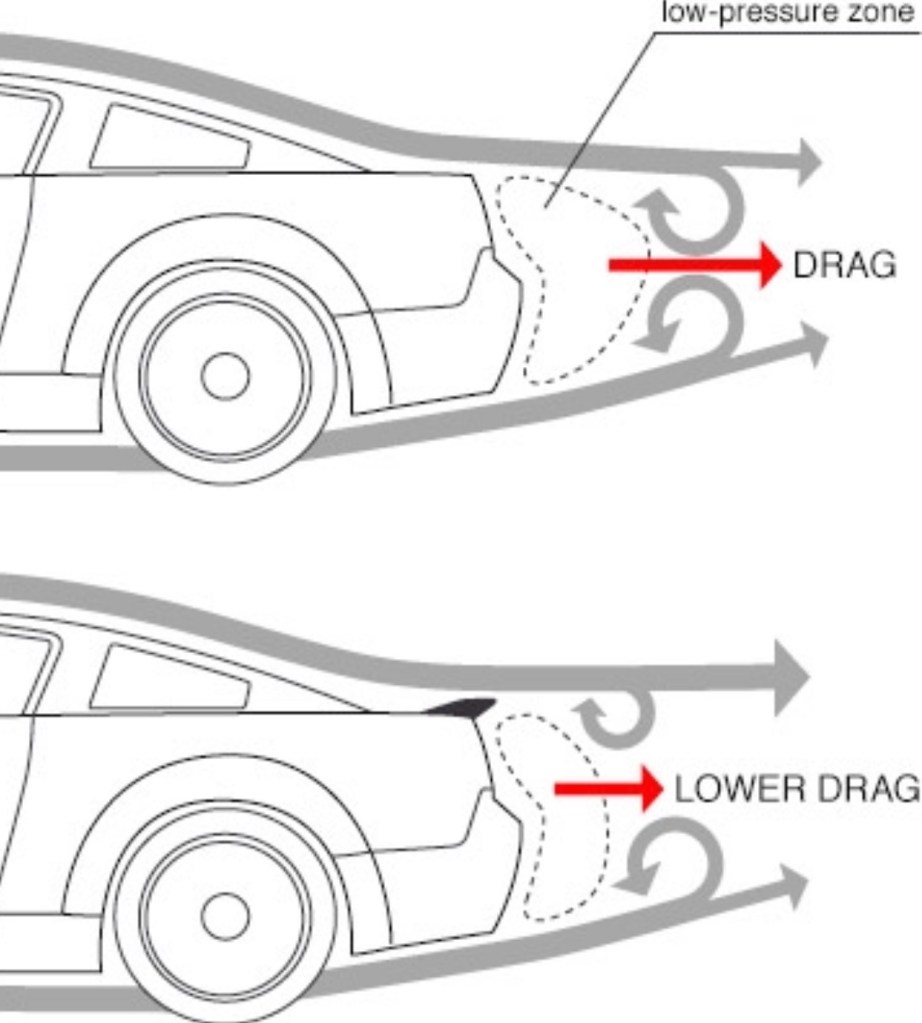
At this point I had a workable vMin table, except for one thing: aero. Cars without aerodynamic downforce lift at speed, which means they lose grip the faster they go. Conversely, cars with aero downforce gain grip the faster they go (well, in relation to cars without downforce). Because WGI has so many fast corners and sees everything from IMSA racers to Spec Miatas, my data was not actually correct, since some cars were lifting off the pavement, and others were pushing into it. For an in depth look at the interplay between tires and aero, see my article on How Downforce Affects Tires, which shows the cornering speed of cars with varying levels of downforce, and their speed through Watkins Glen T10.

To get accurate vMin information, I’d need to know the frontal area and the coefficient of drag and lift from every car in my dataset. This is impossible, especially at the pro level where these secrets are guarded. In addition, pro teams may optimize their mechanical grip for just a couple corners, and make the driver earn their pay in the rest of them. So even if I could get specific aero data on the car, I’m not sure I could use those values for every corner equally.

OK, so instead of 100% accurate data, I figured I could estimate the amount of downforce on every car and log it next to the vMin speeds. After doing that for every car in my dataset, I would then be able to create each car in OptimumLap, run a simulation to see what the difference was in speed and lateral grip, and factor that into the final vMin value for each corner.

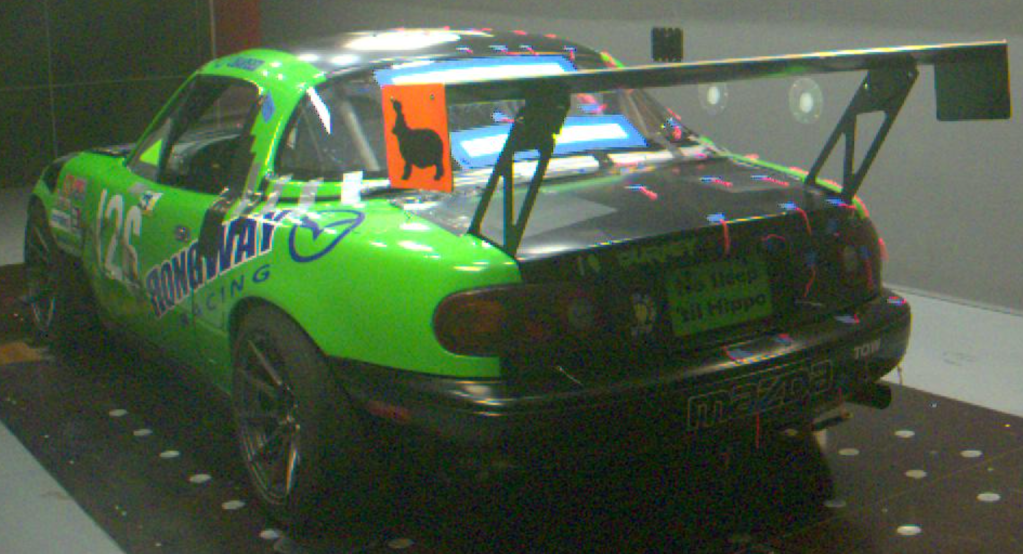
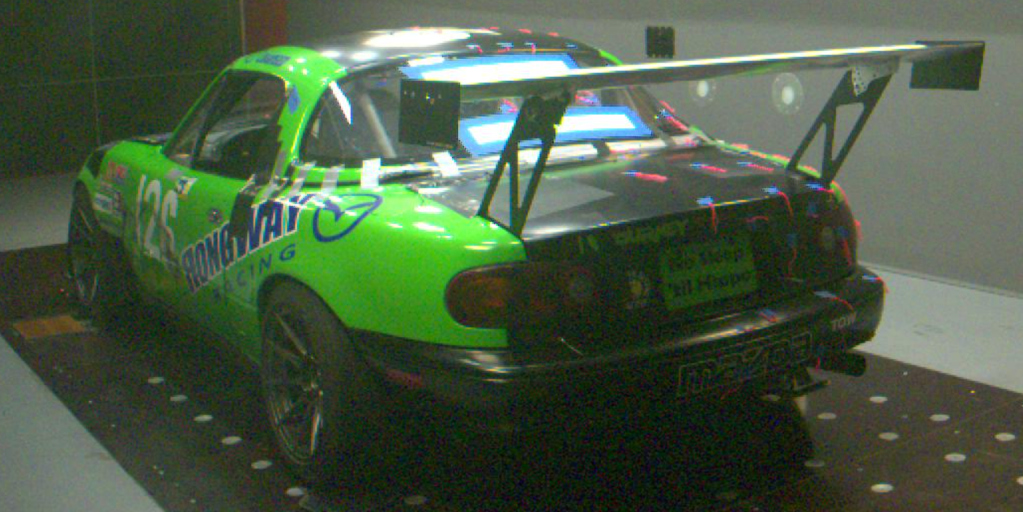
That’s a lot of work, but it’s the kind of thing I’m good at. I’ve done a lot of aero research, and combined with my wind tunnel testing, I can make an educated guess on a car’s drag and lift values, and land within a few percent.

After assigning values to every car and running test simulations, I now had an aero factor for each corner. To get accurate vMins, I just had to classify the car’s aero on a scale from 0 (none) to 1 (lots), factor that into my formula, and then I’d know the approximate vMin.

And here I ran into my first usability problem. My initial goal was to create a mathematical formula to say, “if the car has this coefficient of lift, it should go this much faster through the corner.” But this would require the user to know the coefficient of lift on their car, and then apply a mathematical formula to find each vMin value in the table. Nobody is going to do that.

So what I ended up with are three columns to represent aero: none, medium and big. It’s still up to the user to determine which column to use, and for that I’ll provide some quick guidance here, but also you should look at my article on Thinking in Aerodynamic Coefficients.

  • No aero – This represents most cars without aero, but also a lot of cars with factory wings, front lips, side skirts, and body kits. None of that OE stuff does much for downforce. Coefficient of lift ranges from +0.25 to -0.1.
  • Medium aero – This represents most track cars with wings and splitters or pro-level cars with just airdams and spoilers. Coefficient of lift is all negative (downforce), in the range of -0.3 to -0.8 or so.
  • Big aero – This represents professional aero done correctly, and some amateur-level time attack aero. It’s rare to see this level of aero at the track. Anyway, coefficient of lift is -1.0 and better.

As I’m writing this, it occurs to me that you could average the vMins between two adjacent tables, and in that way get five values for aero. That level of accuracy shouldn’t be necessary for most tracks (corner speeds are lower), but that’s kinda neat.

One more thing to note about aero (and it relates to the dataset in general) is that if you compare the three aero columns, the speeds are the same in Turn 1. This isn’t a typo or error on my part. T1 is certainly fast enough for aero to make a difference, but for whatever reason, aero cars and non-aero cars (driven by pro and expert drivers) go through T1 at virtually the same speed, respective to the base cornering speed.

This is why it’s not possible to assemble an accurate vMin table by measuring corner radius, camber, lateral grip, and coefficient of lift, and then running that through a number crunching algorithm. The drivers are the real computers here, and so it’s necessary to see what they are doing in each corner, not what is theoretically (mathematically) possible.

To find out who the best drivers are, it was necessary to quantify driver skill. This required estimating tire grip for each car and factoring that in. Essentially I was asking this: given this tire and aero, how fast should this car be able to go through each turn? This wasn’t terribly difficult because I have a lot of tire data, and I know how to tweak the values in OptimumLap to return realistic values. This got me close, and in some cases I had to slightly correct the values based on what the best drivers were doing.

With all of this information on tires and aero, I could assign every driver a cornering score. What you see in the vMin table is the best of the best. Some of these are pro drivers, but there are quite a few drivers that have pro-level vMins, with only a single corner and/or some consistency they need to work on.

vMins at other tracks?

You might be wondering if I’ve created vMin tables for other tracks, and of course I have. The ADHD part of me loves the dope rush of starting a new project, but then the realization of actually having to finish it sets in. This ends up with me starting another vMin analysis at some new track and not finishing that one either.

But I do intend on releasing more vMin tables in the future. The next tracks are likely Lime Rock, NYST, PittRace, Thompson, and Mosport, all of which I started and then backburnered.

It’s a time consuming process to find all the data, cull that into an expert driver dataset, log all the data in a spreadsheet, calculate a base corner speed, and then figure out the multipliers for each corner. But the endgame where I have to factor in the aero is particularly lengthy and difficult to get right. Now you know why I move on to the next before finishing.

There’s also the fact that not every race track has corners that are useful for vMin analysis. I mentioned previously that T2 and T3 at Watkins Glen don’t have vMins, and the climbing esses at ViR would be similarly problematic in a slower car. Also very long corners, like the Octopus at NJMP Thunderbolt, or the T8-9 complex at Brainerd, just don’t lend themselves well to vMin analysis, since vMin is then very location dependent.

If you have a track that you’d like me to create a vMin table for, contact me and perhaps I can be compelled to start a new one. (I mean, I can always be compelled to start a new one; I really need some motivation to finish one.) But know this: the accuracy of a vMin table depends on having pro- and expert-level driving data from that track to create a dataset. Without that, it’s a non-starter.

Find a data coach

I hope you get something out of the vMin table and try some of the exercises on the reverse side. Most of you will see a significant drop in lap time, but you’ll eventually hit another plateau, because where your car is at vMin, and where the car is pointing, and how long it’s at vMin (thanks Ross) are more important than the actual vMin number. To work on those, you’ll need a data coach.

I suggest hiring a data coach at the track. While there are coaches and services that will analyze your data remotely, having a data coach at the track with you is much more effective. You’ll shorten the feedback loop and get results that day.

If you’re well connected and monied, absolutely go straight to Ross Bentley or Peter Krause. For people coming to Watkins Glen, I suggest the following.

  • My data coaching partner Chris White is still with Niagara PCA, and also data coaches for the WGI-based Trackmasters group. So if you make it to Watkins Glen for those events, book time with him, I believe this service is still free. Also, Chris tells me that the vMin table is now being used in the PCA classroom, and so perhaps the worm has turned?
  • Gregg Vandivert runs Omega 13 Coaching and is available at several tracks in the northeast. He uses both Aim and Garmin devices at the same time, and combines that with right-seat coaching. I don’t believe you’ll find a better full-service coaching experience. Gregg told me a great story where he got someone six seconds at WGI, and it wasn’t even his student!
  • Patroon BMW visits WGI at least once per year and has a great crew of data coaches. They are headquartered in the Albany area, and so you’re more likely to see them at New England tracks like Lime Rock, but look them up if you’re in their area.
  • I’m available for private data coaching at Watkins Glen and other tracks in the Northeast, but I prefer to do this at Pineview Run. I have a lot of comparative data there, the track is usually pretty empty, and the lodge is air-conditioned with big tables where we can sit and review data. Pineview is a highly technical track, and so it can be even more useful if you’ve never been there before, as you can test your assumptions on driving strategy versus a mountain of data from other drivers. I have a sliding scaled based on dates (was I planning on being there already) and whether or not you own a Porsche.
  • If you’d like to get drill-based instruction and data coaching from me and Ross Bentley at Pineview, sign up for the Ross Bentley Driver Development Program. The 2-day class doesn’t include data, but the 3-day class does, and is offered only on July 25-27. The cost is $4000, but the driver mod will be worth it, many times over.

Long Live the Hankook RS4

My all-time favorite tire is the Hankook Ventus R-S4. They grip well, break away predictably, howl audibly, and stay consistent for hours on end. The symmetrical tread pattern allows you to flip the tire on the rim, and so if you have a camber-challenged car, you don’t have to throw out the tire after wearing out the outside shoulder. On a performance per dollar basis, there is no tire that can equal its combination of grip, durability, and value.

I have heard people complain that they are slow, or suck in the rain, but those people must be comparing them to a Super 200, like a RE71RS or A052. In the Enduro 200 segment, the RS4 is equal to or faster than any other tire.

Several years ago my brother and I tested four 200 TW tires at Thunderhill West in his Yaris. The RE71R was the fastest, but only barely faster than the RS4, and I was most consistent on the kooks. You can read about the subjective testing in Part 1 and data analysis in Part 2. The big takeaway wasn’t just the lap times, but how the tires felt, and the RS4 was my favorite.

If you don’t trust my driving skills, Tire Rack also tested the RS4 versus various other tires. The RS4 was a second faster than the slowest tire in the test, the RT615K+, but lagged 1.5 seconds behind the fastest, the RE71RS. But compared to other Enduro 200s, the RS4’s lap times were right in the middle of the range, equal to the Continental ExtremeContact Force, Michelin Cup2 Connect, and Yokohama AD09.

Tire Rack’s testing of various 200TW tires puts the RS4 right in the middle.

Of course Andy Hollis has also tested the RS4 for Grassrooots Motorsports, and you can read those comparison tests here and here. But another tire test you may not have seen is one of the best tire evaluations I’ve seen anywhere, and it’s from Rugged Badger Racing. What Roy has done in this video is look at tire tests performed by Grassroots Motorsports and others, and normalize the data using tread width and tire width. After much exhaustive research, and a fabulous spreadsheet (which he links to in the comments), he’s determined the speed of each tire, and the cost to run them.

Roy’s data analysis comes from a lot of personal tire testing, as well as research across multiple online tire tests.

As impressive as Roy’s spreadsheet is, there’s a lot of extra data in it, and so I made a copy, hid several columns, and offer you the following distilled version that applies to Miatas only:

Estimated lap time and costs in 15” Miata sizes.

Note that I deleted the Nexen Sport R tire, as they seem impossible to get. I also made the lap time basis an even 100 seconds, so the faster tires can be seen as a percentage faster than the RS4. Otherwise all of the data and analysis is his, and I want to say a big thanks to Roy for nerding so hard on this.

Now if you’re looking at this data and wondering why the A052 is the same speed as a RS4, it’s because the A052 only comes in a 205 width. You really need to watch all of Roy’s video to get the explanations, but as you can see, the 245 RS4 is still the best Miata tire for endurance racing, being only a second or so behind the fastest in class, while costing much less. The Continental ExtremeContact Force is 0.1% faster, but it’s about double the running costs.

Another reason Miata people love the RS4 is because it comes in all the Miata sizes.

  • 195/50-15 – Don’t think of this tire as a 195, it’s actually wider than most 205 tires. This is the perfect size for for 6.5-7.5″ wide wheels.
  • 225/45-15 – This tire on a 9” wheel is one of the best combinations for track driving. The sidewall stretch makes for a very precise turn-in, and a playful and predictable feel.
  • 245/40R15 – The widest 15″ size gives more grip and longer wear, but you should run this on a 9.5″ wide wheel for the best results. If you have a boosted or swapped Miata, these are your dancing shoes.

But not for the Veloster…

As much as I love the RS4, I’ve never had them on my Veloster N. The reason for that is twofold: 19” tires are stupid expensive, and the Veloster can’t easily fit a 245/40R18.

To the first point, I can get a 235-width RS4 in a 19” diameter at a heady $326 apiece. But I wouldn’t put track tires on my OE wheels, nor would I buy aftermarket 19” wheels. This is because, like most track enthusiasts, I swapped the heavy OE 19×8 +55 wheels for aftermarket 18×8.5 +45 wheels. This drops about 10 lbs per wheel, plus the tires are typically 20% cheaper.

Hankook makes a 245/40R18, but it runs wide, and it won’t fit a Veloster N easily. One of the major problems with the VN is the inability to use wide wheels and tires. A Civic Type R comes with 10″ wheels and 265 tires, while the Veloster struggles to fit a 8.5″ wheel and 245s.

This combination just barely clears the fenders with some of the narrower 245 tires, but you might need to roll and pull on the metal to avoid cutting the rubber. If you have coilovers you can get more negative camber, but with just camber bolts and stock suspension, you’re typically stuck with a 235 tire. And this sucks because many of the 200 TW enduro tires don’t come in a 235 width. Continental ExtremeContact Force, Maxxis VR1 or VR2, and my favorite, the Hankook RS4, come only in a 245/40R18.

Coming soon, 235/40R18

I just looked at Tire Rack and saw that they have the RS4 in 235/40-18. Now this was a surprise, because I have absolutely checked Tire Rack’s website many times for this phantom size, and it has never existed before. Thinking this was an error, I went to the Hankook website, and sure enough, the manufacturer doesn’t list this size at all! (Update, now it does, but not on the Shop page.)

I called Tire Rack to investigate, and they assured me that they had this size tire in stock, but there was only one tire. They were as perplexed as I was about why they had just one tire of a new size, but perhaps they were sent an early sample to measure it up?

Looking at the specs of the tire, right away I think I see a mistake. The tread depth is listed as 7/32″, while every other RS4 is listed at 8.9/32″. I think I know what’s going on here, which is that 7mm is equal to 8.9/32″, and so someone entered the tread depth information incorrectly. However, this being a new size, perhaps they changed something? When you create a new tire mold, I imagine there’s an opportunity to sneak in some updated technology, and reducing tread depth would certainly make the tires faster off the shelf.

Speaking of specs, the tread width measures 8.6″. The rule of thumb is to match wheel width with the tire’s tread width (not section width). Many people believe you should fit the widest tires you can, but it turns out that’s not true. Tire Rack did a very good investigation into wheel and tire widths, and found that properly sizing the tires to the wheel width makes the fastest combination, and narrower tires were often faster in the dry, and always faster in the wet. (As a side note, when Tire Rack put out this report and accompanying video, my brother and I vowed to buy all of our tires from Tire Rack in the future. This is the kind of reporting that buys our allegiance.)

So that you can choose the appropriate tire for your wheel width, I made the following table listing various track tires by tread width:

Common wisdom is to match tread width (not section width) to wheel width.

Notice the average tread width of a 235-18 track tire is about 8.3”. Continental and Michelin tires run a bit narrower, while the Super 200 cheater tires (A052, RT660, etc) run wider. But RS4s are also on the wider side, and at 8.6”, the 235 RS4 should be ideal for my 8.5″ Konig Countergrams. Given Tire Rack’s testing, I’d bet even money that the 235 is faster than 245 on 8.5″ wheels.

Up until a day ago I didn’t know which tires I was going to use this year. I almost resigned myself to buying off-brand all-season tires in an effort to find the best of the worst. As fun as it sounds to gather that data, it’ll be great to be back on the kooks again.

Despite only having a single tire in stock, Tire Rack assured me that they would be regularly stocking this size in the future, and that the first shipment is due on April 1st. Trusting this isn’t an April Fools joke, I gave them my credit card number so I can be at the front of the line when they unload the first shipment.

Thank you Hankook for making the RS4 in Miata sizes, and now a Veloster size. Thank you Tire Rack and Roy for exhaustive testing and reporting. Let’s get this track season started already!

Update: Buy your wheels and tires from Tire Rack

Since posting this article I’ve added wheels to my order, and this is significant news for one thing that I just learned: you can order any wheel you want from Tire Rack.

If you use Tire Rack’s website and search for wheels, you must enter your car info. They won’t sell wheels without knowing what car they are for, and they won’t sell you anything with an aggressive fitment.

The only 8.5” wide wheel they’ll sell me for my Veloster N is an Enkei with +50 offset. It’s a fine wheel but at 20 lbs, it’s 2-3 lbs heavier than a Konig wheel of the same size. And while I like the 9-spoke pattern on the TS9, I’d prefer a 10-spoke.

What galls me is that I know for certain that a +43 offset fits just fine, and I also know Konig has a bunch of wheels in the +43-45 range. I also know Tire Rack sells them, but there’s no way to actually order them for my car using their website. However, there’s a simple workaround.

It feels so 1999, but call 888-456-1732 and press 1 for Sales. I talked to Luke, who absolutely knows his shit, and he set me up with bronze Konig Dekagrams in 18×8.5 +43. The price was the same you’d see anywhere else, but also cheaper because Tire Rack will fit the TPMS sensors, plus mount and balance the tires for free. If required, they also send centering rings, lug nuts, and a drive tool for free.

Tire Rack hooks you up with the freebies.

I was already pleased as punch, but then the very next day I got an email to say my order has been shipped! Well either they were sitting on more than a single tire, or that April 1st shipment arrived early. Either way, track season has begun.

Wing Logic vs 9 Lives Racing

The availability of inexpensive extruded aluminum wings has changed motorsports. Ten years ago it was rare to see a wing on a budget endurance racer or HPDE car. Now they are everywhere. A lot of the credit (blame?) goes to Johnny Cichowski of 9 Lives Racing, who sells an inexpensive extruded aluminum wing that sets the standard for the industry.

When you have a winning formula, people copy you. That’s the nature of business. That’s also the nature of racing. And so it’s no surprise that someone else has created a similar product.

This new extruded aluminum wing comes from Michael Jui of Wing Logic. He got wind that I was going to a wind tunnel, and asked if I would test his product. Of course I said yes, because I want that data, and I think the racing community as a whole would like that as well. So let’s take a look at this new wing in as much detail as I can, and compare it to the 9 Lives Racing Big Wang.

Wing Logic’s chord measures about 9.8”, while the 9LR wing is 9.2” across the top. So, the Big Wang is actually the smaller wing.

The wingspans are slightly different, as Wing Logic’s comes in standard lengths of 60″, 65”, 70″ and 72″. 9 Lives makes their wings to fit certain models, but you can also order a custom length. This is important because most racing rules limit wings to body width, and so if you have a Miata, you need to trim an inch off the 65″ Wing Logic, and re-tap the holes on one side. I didn’t do that for this test, so Wing Logic has a slight advantage, with 1″ more wingspan.

The construction of the wings are pretty similar, but Wing Logic has some extra internal thickness in a couple places, and while 9 Lives uses 5mm hardware for the end plates, Wing Logic uses 6mm. The Wing Logic end plates are 3mm, which is thicker than I’ve seen anywhere. All of this adds up to a wing that is sturdier, but heavier. A 65” Wing Logic fully set up with end plates and welded bottom mounts weighed 16.6 lbs. A 9 Lives 64” wing dressed the same weighed 14.6 lbs.

Wing Logic is 2 lbs heavier.

The shape of the wings are similar, but not the same. Anyone who says Wing Logic copied the 9 Lives Racing shape is simply wrong. As near as I can tell, Wing Logic is using a CH10 (Chuch Hollinger CH 10-48-13), which is a low Reynolds high-lift aviation airfoil, while the 9 Lives Racing wing was designed as a motorsports wing from the start.

If you measured Wing Logic in Benzing coordinates it’s a Be 133-105, while 9 Lives measures Be 123-125. That means the position of maximum thickness and maximum camber are the same in both wings, and that’s why they look similar. But Wing Logic’s is thicker and 9 Lives has more camber.

9 Lives top, Wing Logic bottom

If you want to dive deep on that topic, I wrote an article on Car Wing Comparisons. Of all the wings I investigated, the most efficient was the CH10. But that is based on free stream efficiency, which means that the wing is not on a car, but just suspended in the air.

Cars are large and aerodynamically inefficient compared to wings, and when you put a wing on a car, the drag doesn’t go up that much, but the downforce does. So you usually get the best vehicle efficiency by choosing a wing that has the most downforce, not by choosing a wing for its efficiency or low drag.

Enough preamble, how do the wings compare in the wind tunnel?

Wind tunnel testing

I use the A2 wind tunnel, because for people like me, it’s the only game in town. I’ve tried to get into other wind tunnels, and either I’m not allowed, or it’s prohibitively expensive. The Aerodyne wind tunnel next door has a rolling floor, and I’d like to try it, even if it’s 4x the cost. But the rollers are designed for NASCAR, so unless I bring a car with a 109″ ish wheelbase (Miatas are 90″), I’m shit out of luck.

A2 doesn’t have a rolling floor, and so the effect of the tires rolling on the ground can’t be measured. This is significant for underbody testing, but you can measure things on the front of the car and over the body with acceptable accuracy.

There’s a lot of online conjecture by people who have never been to A2, that the small size of the wind tunnel, and the proximity of the walls, contributes highly to a blockage rate (or ratio?) that makes this wind tunnel results inaccurate. However, the walls in the tunnel are designed to reduce the blockage, by being curved rather than flat. And I’m also not after 100% accuracy, I’m looking for deltas – the difference between this or that. Did this wing have more or less drag than the previous wing? Did it produce more or less downforce? These things can be measured with accuracy at A2.

For the wind tunnel testing, I wanted to to use a car that already had CFD done on it, so I borrowed Phil Sproger’s car. His NA Miata has a 9 Lives Racing medium aero kit, and we set the ride height so that it would be as close as possible to the specifications that Morlind Engineering used when they ran CFD for 9 Lives Racing. (AJ Hartman and I did 42 runs on this car, baselining the car vs CFD, and then testing wings, spoilers, fastbacks, and many other ideas for drag and downforce. You’ll be able to read about that in a future report.)

9 Lives Racing Big Wang.

We tested a 65″ Wing Logic back to back with a 64″ Nine Lives. Wing Logic has a built-in 1/4″ Gurney flap, and 9 Lives Racing has a slot for Gurney flaps of various heights, and we used a 1/2” Gurney. But because the slot is slightly recessed, this is more like 3/8”. So while one wing was slightly larger, the other had a slightly taller wicker, and it should be a fair fight.

Wing Logic – notice the smaller end plates.

I also threw in a strange DIY wing I made to see how it compares. It measures 41″x16″, and looks like an old-school F1 wing. The low-aspect ratio would not work in its favor, however the extra chord should make the wing slightly more efficient by having a higher Reynolds number.

Let’s see how they measured up at 100 mph, using the following fields:

  • Front downforce – This is a negative number, which you can think of as lift. When you add rear downforce (or drag), it lifts the front of the car through leverage, like a see-saw.
  • Rear downforce – This is the wing’s job, and varies with wing angle, Gurney flap height, and many other variables.
  • Total downforce – Front lift and rear downforce combined.
  • Drag – The number of pounds of drag the wing adds. This is a pretty meaningless number on its own, but is used to calculate the L/D ratio.
  • HP – An easier way of thinking about drag is how much horsepower it consumes.
  • L/D ratio – This is also known as aerodynamic efficiency, and is usually a good way of determining which part is better on the car. Note that the numbers in this table are not the bullshit free-stream efficiency you see in CFD, but the actual returned efficiency as run on the car.
Three wings compared at zero and 5 degrees.

As you can see from the data, at zero degrees angle of attack, Wing Logic, 9 Lives Racing, and my DIY wing are all better than a 10:1 L/D ratio. At this setting, the Big Wang makes the most downforce, and is thus the most efficient by about 5%.

When I set the wings to 5 degrees, Wing Logic and 9 Lives are identical in terms of aero efficiency. The Big Wang makes slightly more downforce, but the bigger wing makes less drag, and they are effectively the same at this setting. This is also about the maximum angle you can set, because air is coming down the roof at 5-7 degrees, and so if you use more angle than this, the center of the wing stalls, which adds drag and reduces downforce.

As a side note, my chunky DIY wing was similar to the other wings at zero degrees, by virtue of less drag. I should have tested it at the same 5 degrees as the others, because it was stalling at 7 degrees. It’s definitely the worst wing here, but not by a lot. On the plus side, it weighed on average 6 lbs less than the aluminum wings, and it cost me $30 in materials!

To get back to the actual contenders here, the two aluminum wings performed the same at 5 degrees AoA, but that isn’t the whole story, because the Big Wang is dimensionally the smallest. If you are racing in a class that limits total wing area (GLTC 500 square inch wings, for example), then the 9 Lives wing will give you about an 8% advantage over Wing Logic. It’s not a huge difference, but in a rule set that limits wing area , I’d take the Big Wang.

The full results of the wind tunnel testing are in my Miata Wind Tunnel Report, where I go into not only wings, but different tops, front end options (canards, hood and fender vents, splitter adornments, etc. You can purchase the report here by clicking the button, and you’ll get a link where you can download it.

If you don’t want to invest in the wind tunnel report, but you want to support this kind of investigative content, Buy Me a Coffee. It takes 15 coffees ($5 each) to pay for one run in the wind tunnel. That doesn’t count the many hours of preparation, towing 11 hours each way, gas, hotel, and other expenses I accrue on the way. Your support makes it possible for me to do community-driven wind tunnel testing. Thanks!

CFD vs wind tunnel

Both 9 Lives Racing and Wing Logic publish CFD results of their wings, and I thought it would be illuminating to see how accurate those are compared to the A2 wind tunnel. Wing Logic use Kyle Forster to do their CFD, and he used a 70” wing on a Mustang rather than a 65” wing on a Miata, so it’s not a direct comparison. Kyle used the same CFD settings as he did for AJ’s wings, which have generally landed within about 3% on loads in the same tunnel with matching cars/positions etc, so A2 correlation should be OK for this data.

Note that the reference area for the Miata is 1.67 meters squared (18 square feet), while in the CFD, it’s set at 1 meter squared. Ergo, I need to multiply the CFD numbers by 1.67 so that they match the wind tunnel data. When I do that, you can see, the wind tunnel returns similar downforce as the CFD, but drag is higher in the simulation.

Wing Logic wind tunnel (65″ Miata) vs CFD (70″ Mustang)

Is this a big problem? Not really. After testing the same wing on a Veloster N, an 8th Gen Civic coupe, a Miata, and a Supra, I can tell you that the shape of the car has a greater impact on a wing’s performance than any CFD error. On a hatchback, I’ve seen a 3.5:1 L/D and on a coupe up to 24.5:1. In the end, the main difference between CFD and wind tunnel results isn’t computer vs real world, it’s the shape of the car. A Miata ain’t a Mustang, and that’s likely where most of the differences lie between the Wing Logic CFD and wind tunnel data.

9 Lives Racing also publishes CFD using a 64″ wing on a Miata, and that’s exactly what we brought to the tunnel. So we can get an apples to apples comparison on this wing for shiz. But 9 Lives doesn’t publish coefficients, they only give us drag and downforce. Still, it’s enough to work from.

9 Lives Racing wind tunnel vs CFD at 100 mph.

Comparing the wind tunnel results to CFD, the computer predicted both less drag and less downforce than we got in the wind tunnel. The fact that the CFD was off by 33% in downforce points to some kind of problem with that model.

I base that on another nugget Kyle dropped on me which is that as a general rule of thumb, if CFD is off by <20% it could be correlation, <30% it’s setup differences, >30% something has gone wrong with the output numbers at some point or the CFD is extremely broken. So I’m not sure what’s going on with the 9 Lives / Morlind Engineering CFD, but it’s not matching real-world values very closely. When we tested the whole car (not just the wing), the drag was also off by a lot (as in .4 vs .6).

70″ Wing Logic, end plates, 3/4″ Gurney

I was also able to test a 70″ Wing Logic on my Hyundai Veloster N, which allowed me to compare the effect of wingspan on a hatchback. Last year I tested a 55″ Big Wang on my Veloster, and since Wing Logic and 9 Lives are pretty similar, I can get find out how much I was giving up with a shorter wingspan.

I also wanted to try 12″ square end plates to see if the smaller end plates were giving up some performance. And since Wing Logic has a built-in Gurney flap, I also wanted to see what would happen if I butted up a 3/4″ Gurney flap against that. (If you’re wondering what a 1/2″ Gurney would do, you can just average the numbers).

70″ Wing Logic on Hyundai Veloster N.

Comparing the 70″ Wing Logic to 55″ 9 Lives is absolutely not fair, so think of this only as a comparison of wingspan. The longer wing made 10 lbs less downforce (what in the actual fuck?), but had a lot less drag. The end result is a much better L/D ratio of 7.4:1 for the longer wing compared to about 3:1 for the shorter wing.

Now this is flatly absurd, because according to Kyle, an increase of 100mm span is worth about 7% load on the same car, so an increase in 15″ span (375 mm) should be an increase of 26% difference in load, not a decrease of almost 7%. I’m not sure what’s going on here, as the wing was in a similar position, and on the same car.

Changing the smaller end plates for 12″ square end plates added 7.2 lbs of downforce, but also used an additional 1.1 hp in drag. The change in parts returns a L/D ratio of 1.3:1, which means the smaller end plates would be faster anywhere but an autocross course.

Adding a 3/4″ Gurney flap added 48.1 lbs of downforce for 21.4 lbs of drag, which works out to a 2.25 L/D ratio. If you need more rear downforce, adding the larger wicker would be worthwhile on just about any track that isn’t a high speed oval.

Conclusions

Comparing the two wings, my main gripe is that Wing Logic’s wing is 2 pounds heavier than a 9 Lives wing of the same length. That’s not a lot of weight, but the location of the weight, high up and at the polar end of the car, isn’t helpful. As previously stated, in a racing class that limits the wing size to a certain amount of total area, 9 Lives has a slight advantage.

Those negatives aside, Wing Logic has a fine product that is well constructed and performs similarly to the Big Wang. At $349-399 with free shipping, Wing Logic’s wing is a downright bargain.

DIY Rocker Vents

In a previous article I covered Miata fender vents in some detail, including commercially available louvers and DIY solutions. I cited Race Louvers wind tunnel data, which found that after a certain size, more vents don’t equal more downforce. What I didn’t mention was the reason for those diminishing returns.

All of this venting is overkill unless you can reach further inside the wheel well.

Take a look at a Miata unibody with the fenders removed, and you can see the problem. At the top of the fender, vents can reach just about the width of the tire, but the air has to travel all the way up there in order to be extracted. A more direct route is behind the tire, but the chassis is in the way! Moreover, air needs to take a 90-degree turn to make its way out of the wheel well. On a Miata, there’s a sharp lip here where two seams come together, which makes it even harder for air to turn the corner.

Naked Miata shows the crux of the problem.

In order to extract more air, the vents need to reach further inside the wheel well. Ideally the vent should be located low and behind the tire, because that’s the most direct exit route from the trailing edge of the splitter. And while doing that, you’d also design a much smoother exit. The end result would be quite different than the haphazard dumping and venting of air into the wheel well, and more of a purposeful and free-flowing duct from splitter diffuser to behind the wheel. Now these aren’t new ideas; you can see all of that on a McLaren M8 from half a century ago.

McLaren M8 had big vents and smooth exits back in 1971.

A more subtle solution can be seen on the underside of current NASCAR stock cars. Notice the air channels behind the tire that exit at the front of the rocker panel. This allows the cars to look stock-ish, but they perform much better and make a lot of downforce. In fact too much downforce, because NASCAR had to reduce the effectiveness by adding splitter stuffers.

NASCAR underbody aero was so effective they required splitter stuffers (the black horizontal bars in the splitter diffusers) to reduce front downforce.

I don’t know if these vents have a proper name, but I’m going to call them rocker vents based on their location in the rocker panels. They are a very Occam’s Razor solution to extracting air from under the splitter; of the myriad ways you might solve the problem, rocker vents are the simplest. Well, at least from the perspective of air, it’s the most direct route.

I wanted to implement something like the NASCAR rocker vents on Falconet, but hadn’t seen anyone else modify their Miata in such a manner. AJ Hartman did something like this on his Mustang, and said it was very efficient, with a L/D of 14:1.

So I knew it could be done, I just didn’t know how to do this on a Miata. I did a lot of exploratory cutting on the driver’s side, and the pictures show how I did a much cleaner job on the passenger side.

I want to thank Aussie reader/supporter Jim Grant for assistance with this project. He recognized I had no idea what I was doing and explained how cars are put together, and how to get my head out of my ass. Thanks Jim!

Step 1: Measure

My first decision was how large (height and depth) to make the vent. There are a few considerations for height, see the following image with colored lines.

Three logical places to cut.
  • The white line is the most conservative cut, because it goes just below the curved wheel tub inside the wheel well. Cutting at this height leaves two threaded holes intact, in case you want to add bolt-on fender braces.
  • The yellow line is about where the mid-body style line is on a NA Miata. Aesthetically, this is probably the best place to cut a NA Miata, but on a NB it wouldn’t matter. This cut goes between the two bolt holes, and so you could still use the upper hole to mount something.
  • The red line is to the top of the wheel tub. You could go higher than the red line, but most of the air you’re trying to extract is below the splitter, so I’m not sure if a higher cut helps that much. Might look cool tho.
Bring that rocker vent all the way to the top and it might look like a RX-7 GTO. Fucking badass.

In retrospect, if I did this again, I’d cut on the yellow line. Mostly because I think it would look better to have the duct exit on the style line. I don’t know that there’s a lot more air to extract at that height, and it could be that a vent even half this high is just fine (the NASCAR vents are quite low). In any case, I used the white line.

The next decision is how deep to make the cut. I measured and marked a line 9.5” from the inside of the wheel tub. This is where the inner sheet metal is located within the footwell, and so the cockpit remains unmolested.

I removed the white crosshatch area, it starts about 9.5” from the inner wheel well.

The rocker vent would be more effective if I had cut further inside behind the wheels, but then I’d need to weld sheet metal inside the cabin. Going further than that, there’s other unibody structure and cage tubing that would be difficult to work around. If I’d kept going deeper, I’d hit the clutch dead pedal, which could be sacrificed I suppose, but I do use it.

All said, I chose to make the rocker vent only about 3” (75mm) deep. This isn’t a lot of extra volume, but it does allow air to exit at less of an angle.

I used a sharpie to draw a line back to the hinge at my desired height. I’m not going to use the lower hinge (my doors are only half height), but there’s a vertical chassis member here and I wanted to keep that intact. So at this point, I have defined the area I want to remove.

Take a minute to pause and question if you’re really going to do this.

Step 2: Surgery

I used a grinder with a cutoff wheel to cut along the lines. There’s a horizontal shelf inside that has to be removed. It’s spot welded in various places (you can see the dots) and I tried drilling those out and in some cases getting in between with a cold chisel and breaking the welds. This little shelf is a pain in the ass.

Cut an opening so that you can remove the shelf.

I continued to cut out all of the sheet metal and spot welds until I had a rectangular-ish hole like this.

The point of no return. Or, what the fuck have I done?

The interior footwell and exterior wheel tub are two pieces of sheet metal with an air gap between them. I used a cutting wheel to make a slit in this area, and then used a reciprocating saw to cut out the sheet metal. I ended up with a cavity or “smile” between the interior footwell and the fender well.

Cut out all the sheet metal between the footwell and the wheel tub.

To get a smoother exit for air, I used a cut off wheel to cut several straight lines through the bottom sheet metal. I then bent the sheet metal upwards to close that gap.

Slits make it easy to bend the bottom upwards.

I used a hammer to tap these into a more graceful arc.

I should have cleaned off all that gunk with a wire wheel before starting. This needs to be bare metal for welding.

I then cut the front of the rocker panel off at an angle, so that air can make less than a 90-degree exit. Notice the rocker panel is made of a few layers of sheet metal, and plays a significant role in chassis structure and stiffness.

Front of rocker panel cut at an angle.

Next I’ll weld in some sheet metal to cover all this ugliness, and provide a smooth path for air to flow.

Step 3: Welding

Welding Mazda sheet metal kinda sucks. I was once a certified structural welder, but you’d never know looking at the shit job I did on this. I got the best results by spot welding pieces together, and then joining some of those to create stitches. Note that continuous welds are unnecessary, as you can fill the gaps with seam sealer.

First step was to bend in a piece of sheet metal to make a smooth curve, and then cut it to size.

Nice curve.

Next I welded in a horizontal flat that makes the ceiling part of the vent. Otherwise there would be an open cavity that might collect gunk inside. I welded that to the curve I had cut.

The ceiling of the vent.

Next I welded the tabs I cut in the footwell area, that I had bent upwards with a hammer. I ran a cutoff wheel into the overlapping pieces of metal and pulled the little triangles out, then smashed it all flat again. This way the seems were pretty tight and easy to weld inside and out.

Bend tabs up, close the gaps, and weld.

Now the fun part, bending sheet metal into curves and tacking it into place. I used aviation shears to cut sheet metal into various shapes, and then tack welded it all together. This process is more art than science, and satisfying work.

Small pieces of sheet metal can be bent and spot welded to make easy curves.

The next step was to add external bracing to the shotgun panel (the frame member that connects the door hinge area to the shock tower). There are several commercially available fender braces, but I chose to DIY my own and weld it on rather than use bolts.

DIY fender brace and welding spots.

I used 1” square tubing and 1/8” steel spreader plates to make a triangular brace. Weight weenie that I am, I was pleased they only weighed 3 lbs apiece. I then welded the braces in several spots, choosing places where the sheet metal overlapped and was doubled in thickness. I also seam welded the entire front of the chassis for good measure.

Front view shows the 3” (75mm) of extra depth cut inside the wheel well, and rounding underneath and at the exit.

I ordered a new set of fenders, which I’ll cut artfully to expose the rocker vents. In the meantime, I took my existing fenders, which have a large fender cut, and mounted them up to see what this all looks like.

When looking at the rocker vent from the rear, you can see that air will exit much lower and smoother behind the wheel. No more 90- degree bend or having the air exit between the chassis and the quarter panel.

Big vent with a smooth exit will help the splitter make more downforce, and should cool the brakes as well.

Step 4: Finish

The final steps are to fill the gaps between the spot welds with seam sealer (automotive caulk). I have also heard that you can fill the rocker panel and front cavities with expanding foam, which supposedly adds more rigidity. I don’t know that expanding foam from a can (Great Stuff) is appropriate for this, but it would certainly be easy to do.

I’m not going to cover the rocker vents with quarter panels; the area will be entirely exposed. So it needs Bondo, primer, and paint to match the bodywork. I haven’t done all that yet, but it’s just regular bodywork, and I’m the last person you want to watch do that.

When that’s done, I’ll also add some vanes under the car. I’ll take my inspiration from NASCAR again, and guide the air out the new rocker vents with a pair of strakes.

Wind tunnel test?

I’ll add strakes like these red ones.

To find out how much downforce and drag the rocker vents make, I’ll fabricate rigid covers that approximate the shape of the original bodywork. I’ll then remove the covers and A/B test the vents back to back in the wind tunnel.

The A2 wind tunnel has a static floor, and so it’s not as accurate as one with a vacuum to remove the boundary layer, or a rolling floor. So while the numbers won’t be 100% accurate, there will be a useful delta value, and a way to compare the rocker vents to other vents.

Caveats aside, I’ll update this article with those results sometime after 6/20.

Now it’s your turn

If I’ve inspired you to make rocker vents, consider the following:

First, do you really need rocker vents? A splitter alone makes enough downforce to offset a low-angle single-element wing. Add splitter diffusers and vent the fenders, and you may get another 50% more downforce. Add spats, side plates and canards, and you could double the original splitter’s downforce. At this point you’ll almost certainly need maximum wing angle and a Gurney flap, and even then the front aero load distribution may be too high (oversteer in fast corners).

But if you’ve already done all the tricks and still need more front downforce, then the rocker vent is perhaps the next step. But you’ll probably need to add some combination of spoiler, second wing element, and rear diffuser.

On the other hand, maybe you’re not after maximum front downforce and are simply after better efficiency, or maximizing the effectiveness of the undertray. Or perhaps you’re dodging the points taken for using a splitter, but you want similar downforce. That’s a pretty clever use of rocker vents, and I would definitely get on board with any of that.

Next question, do you have a full cage? You’re removing important structure from the unibody and a full cage is arguably a requirement for rocker vents. Without a cage, you’ll need fender braces or other supports that help support the shock tower (no, not a strut tower brace).

As a practical matter, most commercially available Miata fender braces use the two threaded bolt holes in the wheel tub for mounting, and the location of those bolts limits the size of the rocker vent. If you recall the previous image with the horizontal lines, you’ll want to cut on the white line, or lower.

If you make rocker vents, you’ll need a full cage and/or fender braces. Some bolt-in solutions shown.

Final question, if you’re racing, do your rules allow modifying the unibody structure? For any Spec racing series, that answer is certainly no. For other series, it will depend on how they evaluate such modifications.

I’m building Falconet to the NASA ST/TT 3 rules, and changes to the unibody require the “non-production chassis” mod, which is a .4 points penalty to the lbs/hp calculation. If I was building to the NASA ST/TT 4-6 rules, then this modification would be illegal, as the rules state you can’t alter the unibody.

My car also fits into SCCA Time Trials Unlimited 2 class, and this would be legal. But not in any of the Max classes (in fact Falconet isn’t legal in Max for other reasons as well).

I didn’t look up the SCCA road racing rules because it’s a 1000 page rule book. Nor did I look at the 400 page autocross rules, because this is an aero mod, and unlikely to help much at 40 mph. But there’s probably some flavor of unlimited class my car would fit into if I wanted to roadrace with the SCCA or dodge cones in a parking lot. (I don’t.)

Most of the Grid Life Trackbattle classes state that you can’t make modifications to the chassis, and that includes GLTC. But you should be able to get away with rocker vents in Street Mod, Track Mod and the Unlimited classes.

Most endurance racing rules would allow rocker vents, and with their high efficiency, it would be a good idea for AER, 24 Hours of Lemons, Lucky Dog, Northeast GT and WRL. Champcar would assign material points (2 points per square foot of metal), and that might be 4 points total. But a clever team could reuse sheet metal taken from various weight loss trimmings and/or use the lower quarter panels and do this mod for free.

If you aren’t racing or tracking your car, one could argue that rocker vents are a lot of work for Racing Inspired Cosmetic Enhancement (RICE). But if that’s the way you roll, you’ll one up everyone else’s fender vents at the local cars and coffee.

All told, this project cost me maybe $40 bucks in materials (8 feet of 1” steel tubing, welding wire and gas), so if you have more time than money, I say why the fuck not? So now it’s your turn. Let’s see some rocker vents!

Readers’ Rides: Dylan’s Northstar VVT ITB Stonker

If you’d like your car featured in Readers’ Rides, see the information on this page and then let’s get the ball rolling!

The first Readers’ Rides feature is Dylan Pudiak’s 1991 Miata. I’ve watched his car transform from average, to exceptional, back to average, and then to its current status as the northstar build for all normally aspirated BP engines. What began as an engine failure turned into a journey of epic proportions. It didn’t happen over night.

Dylan’s car build is documented in 24 episodes on the Napp Motorsports channel.

A Hero’s Journey

If you don’t know what the Hero’s Journey is, it’s a template for storytelling where a person goes on an adventure, is victorious, and comes home transformed, with knowledge to bestow upon others. Think of stories like Star Wars or The Hobbit. Dylan’s journey follows this template closely, so I thought I’d tell his story like this:

A hero ventures forth from the world of common day into a region of supernatural wonder: fabulous forces are there encountered and a decisive victory is won: the hero comes back from this mysterious adventure with the power to bestow boons on his fellow man.

The Call to Adventure

Our story begins with a Call to Adventure. For Dylan and many other driving enthusiasts, that call was autocross. But on his way home from dodging cones, our hero encountered Supernatural aid in the form of bad luck. Or as many early Miata owners know it, SNC Life.

The World is Yours! Right up until you shear the crank bolt.

When the Miata was released in 1989, the engine had a short-nosed crank (SNC) that could eventually wobble or shear the crank keyway. Half way through 1991, Mazda released long-nose crank engines to fix this problem. Fortunately for us, Dylan had the earlier 1991 Miata, and while driving home from his call to adventure, the crank bolt ejected itself.

The common solution to this problem is to find a later 1.6 engine with a long-nose crank and replace the whole mill. But that would be the end of the story, and a pretty boring one at that. Instead, Dylan recognized that the Threshold Guardians to a faster autocross time were the lack of power from just 1597cc and an open diff with a fragile ring gear. Luckily, these things can be easily remedied with parts from later 1.8 Miatas.

The threshold: from known to unknown

A significant part of the Hero’s Journey is the journey into the unknown, and for Dylan, this begins with swapping in a 1.8 (BP05, 1994-1997). Most people would have chosen a later model VVT engine, but a standard 1.8 was the easy button, because he could keep the 1.6 AFM and ECU, and do an exhintake cam swap as well.

The exhintake cam swap is where you take an exhaust cam, grind off one end, install it on the intake side, and re-time it. The exhaust cam doesn’t have any more lift than the intake cam, but it has more duration. When properly tuned, this can add up to 8 hp, which puts the engine close to what a VVT makes.

For simplicity, Dylan kept the ECU from the 1.6, as well as the air-fuel meter (AFM). The AFM is a flapper type valve that doesn’t flow enough for anything more than a stock motor. People with modified 1.6s often use a RX7 AFM, which instantly gives more power on the top end.

1.8 engine… but what’s that thing in the corner?

I don’t believe I’ve seen anyone swap in a 1.8 engine and keep the 16 AFM; most people splice the wiring to run a 1.8 ECU and much less restrictive MAF sensor, or better yet, go to a standalone ECU. The path less chosen probably cost Dylan a few ponies, and with this combination the car put out 102 hp and 100 ft-lbs on a Land and Sea dyno. These dynos read lower than Dynojets and after correcting by 112%, that’s something like 114 hp at the wheels. This is respectable, but if he’d done all of that with a Megasquirt, he’d be looking at something in the mid 120s.

Dylan lapping his 1.6/1.8 mutt at Toronto Motorsports Park

To put the power to the ground more evenly, Dylan had to address the other Threshold Guardian, the open diff and 6″ ring gear that can break on stock power. He found a 7″ ring gear and Torsen LSD locally from Stefan Napp, which brings us to the other important character in this story.

Han Solo, Gandalf, and Goldilocks

In Dylan’s Hero’s Journey, Stefan Napp plays several important roles, and is simultaneously Helper and Mentor. He’s like Gandalf, Obi-Wan Kenobi, Samwise Gamgee and Han Solo all wrapped into one. Later, he’s also Darth Vader and a drug-pedaling pimp, but that’s getting ahead of the story.

With Stefan’s guidance, Dylan swapped his 1.6/1.8 mongrel, to a junkyard VVT, and then threw the Napp-recipe at it:

  • VVT sourced from a junkyard
  • Head work, ported and shaved 0.040″
  • Custom bumper routed intake, Skunk2 intake manifold
  • Raceland header, custom 2.5” exhaust
  • Megasquirt 3
  • 150 whp, 127 ft/lbs on 93 octane, as measured on a Land and Sea dyno

All of those modifications resulted in 150 whp on Rick Gifford’s “heartbreaker” Land and Sea dyno. On a Dynojet, that’s probably in the neighborhood of 165 whp. It’s worth pausing a moment to mention Rick, because he’s a Gandalf-level engine tuner with a dyno at his house. He serves as another Mentor character in pretty much all the Dylan and Stefan stories. (Rick also tuned by 1.6 Miata).

So let’s call it around 165 (Dynojet) horsepowers at the wheels. Sounds perfect doesn’t it?

The Napp recipe for Goldilocks.

In fact it was perfect. I drove Dylan’s car at Pineview Run, and it was the Goldilocks of Miata motors: not too much power, not too little, just right. The power felt ideal for the chassis, retaining all of the characteristics of a momentum car, yet providing instant tractable power, and enough oomph to occasionally surprise.

I still don’t know that there’s a more satisfying combination of engine and chassis, it was magical. Stefan’s K24 Miata was there the same day, and I honesty liked Dylan’s more. That’s really saying something.

On a personal note, driving Dylan’s car at Pineview was also the moment I realized I was a complete dumbass. At the time I was being an iconoclast by trying to tune a 1.6 engine, and I thought cams and bolt ons could help my B6-ZE run with BPs. Three corners into driving Dylan’s car I understood exactly what a huge mistake I’d made.

From Goldilocks to Jenna Jameson

Speed is a drug. Napp is a dealer. Dylan saw the huge gains Stefan made, and was naturally tempted to take a bigger hit. Too much is never enough.

So the next stage in Dylan’s journey was to take Goldilocks and hook her on smack, then turn her out onto the street as a common hooker. OK, maybe that’s a little harsh, it’s just a turbo we’re talking about; but it sucks and blows just the same.

Modifications at this stage included the following:

  • Garret gt2560r turbo
  • Flyin miata exhaust manifold
  • Ported turbo exhaust housing
  • Flyin miata oil cooler
  • ATI Fluid damper
  • R8 Ignition Coil Kit
  • 252 whp, 221ft/lbs @14psi (same dyno)

I don’t pay too much attention to turbo Miatas, but it seems like ones putting out mid 200s at the wheels are a dime a fucking dozen. After all the work they’d done to get Goldilocks to dance like a ballerina on swan lake, it seems terribly underwhelming to wind up with a common skank twirling on a brass pole.

Hot. Also a lot of heat.

I didn’t get a chance to drive Dylans turbo at Pineview, but it wouldn’t surprise me if it was slower on that track. But I did get to drive Dylan’s car on the street on the way back from Watkins Glen, and I will say the acceleration was exhilarating. So fucking what.

Part 1 of a 10-part build mistake series.

Transformation and atonement

The next stage in the Hero’s Journey is the revelation that brings our protagonist out of the abyss, transforms him, and sets him on the path to atonement.

What set that off was typical turbo problems: heat. With rose-tinted beer goggles, Dylan looked back on the simplicity, reliability, and ease of driving that Goldilocks NA. And thus the revelation to go back to normally aspirated power. And then go completely overboard, boring the engine to the maximum displacement. And then add cams, shim-under bucket lifters, and ITBs. It has, well, everything:

  • 85.5mm Supertech pistons 11:1 (2L displacement)
  • Manley H Beam rods with ARP main and rod bolts
  • ACL Race main and rod bearings
  • Boundary oil pump
  • +1mm intake and exhaust valves
  • Supertech dual valve springs with titanium retainers
  • Tomei 252 10.8mm Intake Cam, Tomei 256 10.0mm Exhaust Cam
  • Shim under bucket lifters
  • Maruha adjustable exhaust cam gear
  • 0.040” head shave, 0.030” cometic head gasket, final compression 12.25:1
  • Full head porting
  • 3.6kg flywheel
  • Fluidamper 
  • Jenvey ITB’s and SPS plenum
  • Custom halfrad setup
  • Break-in tune without plenum: 184 whp @ 7400 rpm, 132 ft/lbs @ 6300 rpm
  • Estimated 200 whp @ 8000 rpm on E85
Glory.

The end result still needs final tuning, but it’s likely 200 whp on a Land and Sea (heartbreaker) dyno, and well over 200 on a Dynojet. This is about as far as you can go with a Mazda BP engine, and I want to personally thank Dylan and Stefan for reaching the limit.

Suspension, wheels, brakes

You don’t do all of that work and roll around on OE anything. Dylan did it right yet again:

  • Ohlins road and track coilovers, corner balanced
  • Custom extended top hats
  • Racing Beat front and rear swaybars
  • Paco strong arm fender braces
  • 4.1 Torsen diff
  • V8 roadster hubs
  • Full polybushing kit
  • Frame rails
  • 1.8 brakes
  • Hawk HP+ panda
  • 15×9 Konig Countergrams
  • RS4s 225/45
Chasing the dragon.

Aero

I’m an aero guy, so let’s take a look at how the air moves over and around the car. Starting at the front, Dylan has a SPS air dam, AG Limited front lip and custom undertray. The top is a standard Miata hardtop, but has a spoiler extension on the roofline. For rear aero, Dylan has two trunks, one with an Ikon Style duckbill spoiler, and another with a APR GTC200 wing.

’90s perfection

Judged against modern aero like a 9 Lives Racing medium aero kit, Dylan’s aero isn’t quite up to snuff, and probably has a little more drag and little less downforce. But I honestly wouldn’t change a thing! This is 1990s perfection. Visually, this is the pinnacle of Radwood-era aero, and “fixing” this would be as sacrilegious as fixing Jennifer Connelly’s overbite. For a dual duty car that sees more street than track, changing the aero would be pointless.

You’d grin like that, too.

It’s amazing to look back at this Hero’s Journey and appreciate the Gift of the Goddess. Thank you Dylan Pudiak and thank you Stefan Napp, for showing us the way.

Miata Wind Tunnel Test Ideas

I wrote this post a while ago, and since then I made it back to the wind tunnel and tested a lot of things. Sadly, Falconet wasn’t ready for that trip, and so instead I took a Miata with the full 9 Lives Racing medium downforce kit. I was able to test everything that’s been modeled in CFD, and the entire 9LR catalog, as well as many other options, such as fastback, hood and fender vents, and various things to reduce drag and add downforce.

I’m going back to the A2 wind tunnel this summer and I’ll test a bunch of stuff on my Hayabusa-swapped Miata, Falconet. Wind tunnel testing is expensive, and it’s an 11-hour drive each way, so I need to be ultra prepared so that I’m not wasting time and money.

As part of that preparation, I want to know what other people are curious about. Do you have some parts to test? Send them to me and I’ll send them back when I’m done. Do you have some ideas you want to test, but can’t implement? Maybe I can cobble something together in time. Please drop me a comment at the bottom or use my contact form to email me, and I’ll do my best to test what’s important to the Miata community.

One of the benefits to wind tunnel testing is the parts don’t have to be race spec, they just need to survive a couple runs. So a lot of parts go on with the minimum number of fasteners and the maximum amount of duct tape. This allows me to do so a lot more fabricating and testing than would normally be possible.

Anyway, here are some things I’ll be testing.

Canards

I’ll be the first to admit I was wrong about canards, and so this is one area where I’ll be spending a lot of time money. Before I tested my Veloster N in the wind tunnel, I thought canards were poseur junk, but after finding out that changing the height by 8″ made a 700% increase in downforce, I realized I knew jack shit about canards.

I’ll test height to find out the optimal position on the lower canard. I’ll also test size, shape, angle, profile (blade vs airfoil), and end treatment (wicker sizes).

I will not be testing these canards.

Splitter

On my Veloster I tested flat vs curved splitters and found massive gains (150% more downforce) using a splitter that curved upwards at the trailing edge. This is essentially that same thing as using splitter diffusers, but instead of diffusing air into the wheel wells, the air is diffused over the entire width of the car. So I’d like to test this vs a flat splitter with splitter diffusers.

Laminating a splitter with a full width diffuser on the trailing edge.

I also added vortex strakes in front of the wheels and this reduced drag quite a bit, but because those strakes were only on one splitter, I didn’t do a proper A/B test. So I’ll test these again on the same diffuser to see how worthwhile that is.

I’ve seen some online conjecture on the drag from splitter rods, and it doesn’t make a lot of sense to me. I’ll double the number of splitter rods (they’ll be fake) and see what happens.

There’s already published data on splitter length, but I might test this if enough people are hungry for that data. Likewise splitter height has been tested and published (but not on a Miata). Just the same, it’s easy enough to put blocks under the tires and test changes to height and rake, and how that affects downforce and drag.

And I might get around to testing an airdam with an undertray and no splitter lip. I think I can get the undertray to make a lot of suction, even without a splitter lip. This test isn’t a high priority for me, because I’m not personally going to set up Falconet like this, but with enough community whining, this test could go higher up the list.

Underbody

When it comes to underbody aero on touring cars (especially Miatas), I’m a confirmed naysayer. But, just like it was with canards, I might find myself eating my own words after this test!

Some of the things I’ll be testing are a flat bottom, a partial flat bottom (trans tunnel exposed), barge boards, and at least one diffuser. Falconet uses a motorcycle transmission, and so that whole transmission tunnel is open. I’ll diffuse some air into that area and see what happens.

Vents

Al at Race Louvers has some of the best wind tunnel data on the web, and I see no reason to duplicate his efforts. But I have some ideas to get more extraction out of the wheel wells, and these haven’t been tested by him yet. I’ll also be testing a hood extractor vent, which is specific to Falconet, but the data may be interesting to others.

Wings

I’ve already tested and published wind tunnel data on five wings, four end plates, and Gurney flaps, but I have a few things still to test.

I have an oddball wing I made with a short 41″ wingspan with 16″ of chord. It seems absurd, but the additional chord was shown to be very efficient in previous testing, with a clear top-speed advantage. I want to try this as a single and dual element.

There are big wings and big wings. This is the latter.

I’ll compare that wing to a Wing Logic, and that in turn to the industry standard 9 Lives Racing wing. Wing Logic appears to be a CH10, which has less camber and thickness than a Be 123-125 (which is about what the 9LR wing measures). If both wings were the same size and had the same Gurney flap, I’m fairly certain the 9LR would outperform Wing Logic. But this isn’t apples to apples, since the latter has more chord and a built-in Gurney flap. Anyway, interesting comparison.

I may also test my MSHD wing as a dual element. It’s designed as a 3D wing, but unlike many, the trailing edge is a single flat line across the span, and so I can add a second element pretty easily. And I kinda want to make a 2D MSHD, this one will be 63.5 x 11 with a built-in 1/2″ Gurney flap.

MSHD 3D 500 sq-in outperformed all other wings in my testing.

Tops

I tested the first version of my fastback at Watkins Glen, and I’d like to correlate the results from real-world track testing to wind tunnel testing. So I’ll bring an OEM roof and trunk with me and I may as well do one run without the top as well. I wish I still had a Chop Top, that would be worth testing again.

The one time I tried my race car’s fastback on my street car, the engine dropped a valve. But notice how narrow it is at the B pillar.

Open windows

Open windows add drag and reduce downforce, and so I’d like to test various things that may help. I’d like to test a wicker or vortex generator on the A pillar, smoothing airflow out the B pillar, using a longitudinal strake along the top of the window, and large NASCAR-style window nets (which are mostly fabric and not a lot of holes).

Mirrors and mirror stalks are another thing that might affect open windows, or downforce in general. By forcing air downwards, it’s possible to move air away from the windows (and wing). Conversely, moving air upwards may add downforce. And how would these trick mirrors compare to OEM mirrors or no mirrors at all? Gotta find out.

And you?

So that’s at least $4000 worth of testing and I haven’t started on your tests yet. What’s keeping you up at night?

Miata Aero Testing Results

This article was originally spread out over several different pages. I’m not sure what I was thinking at the time, but I’ve reorganized this as a single (rather lengthy) article now.

For the full story on how I performed these tests, see Testing Miata Aerodynamics at Watkins Glen. This article is essentially Part 2 of that one, so I can deep dive on the test results of the various aero options.

Summary data.

While datapoints like pounds of downforce at 100 mph, or horsepower consumed, are things we can wrap our heads around, it’s difficult to translate that into the only thing that matters: lap time. Therefore, in the following sections, I also include lap time simulations using OptimumLap.

Testing Miata tops

The first thing I wanted to test was the largest knowledge gap, roofline shape. This meant I had to have different options, that would come on and off quickly, using the same brackets. The four options were an open top, an OEM hard top, a Treasure Coast Chop Top (which should approximate a hard top with the window removed), and a fastback of my own design. 

I built the fastback before I had the notion to do this test, or I would have built it differently. The main problem is that I made long brackets along the bottom edge, and this required removing the trunk lid. This meant I didn’t get to test any of the other tops with an OEM trunk lid. Instead, I bolted a plywood cover over the trunk cavity. This new trunk lid is about 3.5” taller at the back than a stock trunk. It’s hard to say exactly what the effect of this was, but it’s likely a reduction in drag and lift, akin to adding a spoiler. So when you look at the data later, note that none of the tops used an OEM trunk.

Open top results

Miatas are meant to go topless, let’s start there and address some burning questions: 

  • What happens when you use a wing with an open top? 
  • How much does an open top affect a wing’s performance? 
  • At autocross speeds, is it better to remove the top or leave it on? 

Take a look at the following table, and you can see that an open-top Miata generates about 40% of the downforce as one with an OEM hard top (Total Cl field). Of all the options, this was the worst at creating downforce.

It might be a little confusing that the coefficient of drag (Cd) is better with an open top than with a hard top. This is likely the result of running the tests with the windows open, which turns the hard top cabin into a parachute.

TopFront ClRear ClTotal ClCdL/D %HP @ 100mph
Open top-0.20-0.23-0.430.431.0147.16
Hard top-0.17-0.84-1.010.482.1152.78

Let’s plug these numbers into OptimumLap and see what happens. I’ll use three different tracks to represent a range of speeds. These tracks are already in OptimumLap.

TopWatkins GlenWaterford Hills2010 SCCA Nationals
Open top2:24.021:20.971:03.88
Hard top2:22.961:19.951:03.34

The hard top is worth about one second at both Watkins Glen and Waterford Hills, and just over a half second on the autocross course. 

OEM hard top with plywood trunk lid, a concession to the fastback.

For these simulations, the car weight was kept the same. Someone will point out that the top weighs 45 pounds, and that OptimumLap doesn’t factor in the change in center of gravity. Both true. But I can calculate how much weight you’d have to remove from the open top car to match the autocross time of the hard top, and it’s 210 pounds. I’m not sure how high you’d have to place 45 pounds above the car to equal 210 pounds, but it’s probably pretty far up there!

But running an open top car with a wing has two advantages. One, it looks cool. Two, an open top car with this wing beats any top without a wing, every time. That’s kind of jumping ahead in the data, but it’s worth noting.

Let’s get back to the real world and the test at Watkins Glen. Alyssa reported that the car was more difficult to drive with the open top. She had to brake before entering Turn 10, and then had to manage a car that was oversteering badly. With a hard top, she could mash the throttle from the exit of Turn 9 to the exit of Turn 10. That kind of confidence over an 8-9 hour race can mean a lot more than a second per lap.

Chop Top results

Treasure Coast Miata sells their “Chop Top” for budget endurance racing. It’s an economical and lightweight top that does the job of enclosing the roof. This has two benefits: better aero, and you don’t have to wear arm restraints when racing (the car is no longer considered a convertible). I fabricated mounts that attach to the hard top brackets, and with those the total weight of the Chop Top was a scant 7 pounds. 

There is a persistent myth in Miatadom, that removing the rear window from a hard top is aerodynamically better. So I put two small Lexan covers on the sides of the Chop Top, closing in the sides. This made the chop very similar to a hard top without a rear window. Let’s add this data to the open top and hard top. 

TopFront cLRear cLTotal cLcDL/D %HP @ 100mph
Open top-0.20-0.23-0.430.431.0147.16
Chop top-0.20-0.33-0.530.451.1949.40
Hard top-0.17-0.84-1.010.482.1152.78

As you can see, the chop top allows the wing to work a bit better than an open top, with an increase in downforce. But it’s not as much as you’d think.

However, once you add a wing, the Chop Top performs barely better than an open top. This is interesting, because you’d think airflow over the roof is considerably smoother than an open top. However, it’s what’s happening on the underside of the wing that’s more important, and the Chop Top roof can’t defeat the turbulence coming from the open sides of the cockpit and going beneath the wing.

Chop Top with plywood trunk cover. Note clear lexan and clear gas line, so we can see if the gas is about to overflow.

Next I’ll do the same track simulations, and what I find interesting here is that the Chop Top isn’t really that much different than an open top at any of the tracks. Not enough to really make a difference.

TopWatkins GlenWaterford Hills2010 SCCA Nationals
Open top2:24.021:20.971:03.88
Chop top2:24.041:20.821:03.79
Hard top2:22.961:19.951:03.34

Nevertheless, for those racing with an open top and a wing, the Chop Top is worth a look for a bit of weather protection and not using arm restraints. In addition, we’ve finally dispelled the myth that removing the rear window is more effective. It isn’t. At least when used in conjunction with a wing. 

OEM hard top

All along I’ve been citing the data for the OEM hard top without really discussing it. It’s the status quo in racing, looks great, and performs its duty.

In the data, the OEM hard top generated more drag and lift than what I expected from published data. This is likely due to the open windows and wide canopy, which turns the cabin into a parachute. The drag is supposed to be around .38 with closed windows, but we measured over .5. Lift is also supposed to be the high .30-somethings, and we measured .55 (with vortex generators, I don’t have the raw data without).

The hard top with airdam, splitter, and wing made a killer combo: .48 Cd and 1.01 Cl. Those are good numbers. Racing numbers.

Fastback results

The front of my fastback uses the Treasure Coast Chop Top, and the rear fastback section bolts on and slopes back at about 14 degrees. So essentially the roofline is the same as OEM to about the rear window. Starting with the Chop Top made building the fastback fairly easy, and it was also easy to add and remove for this test. (You can see construction photos this and other tops I’ve built at the end of this article.)

An older photo, but the top is the same.

The Chop Top plus fastback weighed 17 pounds less than the stock hard top, and to equalize the two I bolted 8-pound lead weights to the top of the seat belt towers. This was the only time I made adjustments to the weight of the car, and so the open top and Chop Top configurations were a bit lighter. 

The fastback significantly reduced drag, and helped the wing create more downforce. Compared to the OEM hardtop, downforce increased 129.7%. Another way of thinking of that is that the fastback turned a 60″ wing into a 78″ wing. Or you could say that the OEM hardtop is so bad that it made a 60” wing behave as a 48” wing….

The large gain in rear downforce was offset by a small loss in front downforce. Essentially, the wing was so effective with the fastback that the front end lifted, changing the height and angle of the splitter, reducing its effectiveness. 

TopFront cLRear cLTotal cLcDL/D %HP @ 100mph
Open top-0.20-0.23-0.430.431.0147.16
Chop top-0.20-0.33-0.530.451.1949.40
Hard top-0.17-0.84-1.010.482.1152.78
Fastback-0.12-1.09-1.200.412.9744.81

In addition, the fastback reduced drag by 15%. This in itself is pretty surprising, and not only helps top speed, but fuel economy. Combined, the downforce and drag created a lift/drag ratio that was 50% better than the OEM hard top with a wing. Astounding.

Note that the .41 coefficient of drag is actually quite good when you consider that the wing made the most downforce in this configuration, and just as in all of the tests, the windows were open.

But all was not rosy with this setup. Both Anthony and Alyssa commented that the car understeered badly in this configuration, and was boring as shit to drive. Given time, Jeremiah would have changed the mechanical grip by adjusting the front roll couple, by means of spring and/or stabilizer bar. This would have helped balance the vehicle at speed. 

Let’s do another simulation in OptimumLap. The fastback gains 1.9 seconds at WGI, and about half that at Waterford, which is pretty spectacular.

TopWatkins GlenWaterford Hills2010 SCCA Nationals
Open top2:24.021:20.971:03.88
Chop top2:24.041:20.821:03.79
Hard top2:22.961:19.951:03.34
Fastback2:21.061:19.021:03.12

Vortex generators on an OEM hard top

The shape of the Miata’s canopy is abrupt, and if you look at wind tunnel tests, you can see smoke trails that are turbulent, and then separate, as air moves over the top. Vortex generators (VGs) create a thicker turbulent layer of air, which keeps air from separating completely. This should result in less drag, and may also help interaction with a wing.

Most vortex generators you see are cosmetic fakery and don’t create vortices. I bought the real deal from AirTab. Made of thin plastic, they go on with double-sided tape, just peel and stick. The manufacturer says they should be mounted no closer than 4” apart. I set them at 5” on center, and so that made 9 for the roof.

If you do some research on VGs, there’s good data that they work. They’ve been used on semi trucks, RVs, the underside of race car wings, and many places where flow separation can occur. For cars, take a look at the four-part series on Autospeed, where they tested VGs on a Prius and Insight. Even better, check out Hi-kick Racing’s blog on adding VGs to a Miata. VGs decreased his lap time from 1:02.8 to 1:02.1. Here’s a photo from his site.

AirTab vortex generators.

Nevertheless, my expectations were low. If vortex generators are the cat’s meow, then every cat would have them, right? As you can see in the table below, VGs made things worse. Total downforce decreased by about 20%, and drag increased substantially. Take a look at HP consumed at 100 mph and you’ll see you have five less ponies at that speed. 

ConfigurationFront cLRear cLTotal cLcDL/D %HP @ 100mph
Hard top, splitter, wing-0.17-0.84-1.010.482.1152.78
VGs, splitter, wing-0.20-0.61-0.820.521.5757.58

And this is how those values affect lap time in OptimumLap.

Vortex GeneratorsWatkins GlenWaterford Hills2010 SCCA Nationals
Hard top, splitter, wing2:22.961:19.951:03.34
VGs, splitter, wing2:24.321:20.421:03.54

We placed the VGs at the trailing edge of the hard top, but it’s possible that moving them forward may have helped some. Or perhaps we used too many? I followed the instructions and they were supposed to work. 

The double-sided tape was difficult to remove, and so experimentation with the number and location of VGs wasn’t possible. The only lasting impression the VGs made was the adhesive, it was a bitch to remove and so all further tests would use the OEM hard top and VGs combined.

Miata top conclusions

Different tops change airflow over the roof, and this affects how a wing works. It’s unclear how much of this is is based on turbulence, or because of a change in downwash angle as air hits the wing. It’s likely a combination of both, but we didn’t have time to experiment with wing angle and this mystery remains. 

In addition, our data revealed a rolling rake angle that changes ~ ½ degree depending on rear wing configuration, and this impacted front downforce and distribution more than expected. By adjusting chassis rake and splitter angle, it’s likely the total downforce and Lift/Drag efficiency would have been higher, and this may have reduced rolling-rake changes as well. 

We can make the following general conclusions about using a wing with different tops. 

  • An open top reduces a wing’s effectiveness by about 2.5x. Or, if you thought you were getting 200 lbs of downforce, you’re getting 80.
  • A Chop Top performs marginally better than an open top.
  • The OEM hard top is actually quite good with a wing. But don’t remove the rear window. And don’t use vortex generators.
  • A fastback allows a wing to perform the best, increasing downforce, while also decreasing drag.

9 Lives Racing Big Wang vs cheap dual wing

The low price and availability of aerodynamic car wings are making them more common in crap-can endurance racing. You can buy a cheap extruded aluminum wing on eBay, Amazon, or other online retailers for $50, but are they good for anything?

I broke the piggy bank and purchased a 53” double-decker wing for $75, shipped. This wing is sold under a variety of brand names like BestEquip, Mophorn, Neverland, etc, and I’ll refer to this as the eBay wing, because that’s where I got it. 

Immediately upon unboxing, I knew I’d have to make some modifications. Like most budget items from China, it came with trunk mounts too low to allow airflow to go under the wing. I trusted the supplied mystery-metal hardware as far as I could throw them, which was directly in the trash. 

The main wing felt light, yet surprisingly rigid. The stiffness is partly from the dual horizontal mounting rails, which allow the wing to be mounted at just about any width. However, the exposed slots and flat underside of the wing can’t be great for keeping airflow attached. In the future, I may add some curvature here.

The upper wing felt like a noodle, and I feared it would vibrate and hit the lower wing at speed. So I riveted on a Gurney flap of 1/4” aluminum angle to stiffen it up. I also added a small stop in the middle of the lower wing to limit downward movement of the upper wing.

The end plates had to go, not only because they were too small, but they didn’t allow the upper wing to pivot into the correct position. According to McBeath in Competition Car Aerodynamics, the upper wing should overlap the lower wing at about 4% of the chord (.3” in this case). In order to accelerate the air, the gap must be larger at the front than at the rear. With those two factors set, the slots in the supplied end plates, which support and locate the upper wing, wouldn’t allow us to pivot the upper wing into a useful angle. 

Since I couldn’t get the correct spacing and wing angle with the supplied end plates, I made my own from 12”x10” sheet metal, and drilled new upper wing mounting slots. All done I paid a little over $110 for the wing and modifications, and a couple hours figuring all that out. 

The car was set up with -1 degree of negative rake, meaning the back was lower than the front. Ideally it should be the other way around, but we got lost debugging what we thought was a clearance issue with a front sensor and didn’t correct the angle. 

I set the lower wing angle to 3 degrees, but because of the chassis rake, the main wing was closer to 2.5 degrees. I set the upper wing to 12 degrees. Measured over the entire chord, this created a total camber of about 14 degrees, which is right in the middle of the values that McBeath cites in Competition Car Aerodynamics. Given more time, I would have experimented with the angle of attack of the upper element, as well as the entire wing. However, not knowing how the wing would perform, I chose middle-of-the-road values from a published text, and figured it was more important to avoid a stall condition than maximize downforce. The wing weighed 7.6 pounds altogether, which is very light.  

60″ 9 Lives Big Wang vs 53″ eBay double wing.

The wing I used through all the other testing on at WGI is a 60” 9 Lives Racing “Big Wang”. The standard Miata wing is 64″, but my eventual plan was to end-plate mount this, like a Ferrari F40. I never did get around to that, so the wing is a bit smaller than you’d see on most Miatas. (But as you already saw above, the fastback made it behave as a much larger wing.)

When I took the wing out of the package I was immediately impressed by the sturdy construction. When there are only cockroaches left in the world, there will also be 9LR wings. I made my own 12” x 12” end plates and mounting brackets, and had a local shop weld the mounts underneath. The entire setup was about $500, and weighed in at double the double wing, at 14.4 pounds.

I set the wing angle at 5 degrees, but with chassis rake the actual wing angle measured 4.6 degrees. If you look at the 9 Lives CFD open air data, this is right in the middle of the wing’s working range. I knew the downwash angle would change with every top, and that this would change the effective wing angle. But due to intermittent track closures, I didn’t get a chance to sweep the wing angles, and left it where it was. 

For both wings I used the same wing stands, which I cut from aluminum plate. Many racing series limit wings to roof height, so I made sure the highest part of the wing was level with the roof. I bolted the base of the wing stands through the sides of the trunk gutter, and while this seemed strong enough, I added another L-bracket on top of the rear fenders, and this stiffened things up considerably. 

Wings compared

So let’s see how these wings compared. In this first chart, we’re looking at front and rear downforce using GPS speed alone. It looks like the eBay wing (red) creates more rear downforce as the 9 Lives Racing wing (blue), and when combined with the front, the total downforce is pretty close.

However, the weather had changed during this run, and we had an 11 mph headwind. After correcting the wind speed detected by the pitot tube, a clearer picture developed. See the bar graph below. Here we can see that the eBay wing generated less downforce than the GPS speed would have us believe. This is why you can’t trust testing using GPS speed alone, and why you hire a guy like Jeremiah.

When you add downforce on one end of the car, you can expect to lose downforce on the other end. This is the natural see-saw effect of pushing down on one end. What’s interesting here is that the 9 Lives Racing wing not only made more rear downforce, but it also had more front downforce. How can this be? 

The most likely reason is drag. The eBay wing creates more drag, and this rear-biased force lifts the front end. Whatever the case, front downforce, and thus total downforce, is a lot less with the eBay wing.

Take a look at the following table and you can see the corresponding values for coefficient of lift (which we’ve been familiarizing as “downforce”), and drag. We already saw that the 9 Lives Racing wing practically doubled the total downforce, and here you can see it did that while creating 15% less drag. If you look at the final column in the table, you’ll see that the drag reduction alone equals an extra 8 hp at 100 mph. 

WingFront cLRear cLTotal cLcDL/D%Front Load HP @ 100mph
9LR-0.17-0.84-1.010.482.1116.76%52.78
eBay0.03-0.58-0.560.550.904.43%60.79

If we divide the total coefficient of lift by the coefficient of drag, you get the L/D ratio, which tells you how efficient the entire aero package is. Here you can see the 9 Lives Racing wing contributes to a setup that is over 230% more efficient at creating downforce. 

The data from testing other tops shows that the 9LR wing changes the coefficient of drag by about .03 across all tops, from open top to fastback. By contrast, the double wing changes the Cd by .10. Yowza, that’s a lot.

One final calculation is the front aero load distribution percentage, which gives you an idea of how much the car will understeer (a low percentage) or oversteer (a high percentage). The low values here indicate that with either wing, the car would understeer badly. This is partially due to the negative rake of the chassis and negative splitter angle (both setup mistakes that should have been corrected before testing). However, even with these setup details corrected, the eBay wing would produce a car that understeers more. 

As usual, let’s see what happens in OptimumLap. To spice things up, I’ll also add the data from the 9LR wing with an open top. 

9LR vs eBayWatkins GlenWaterford Hills2010 SCCA Nationals
Hard top, 9LR 2:22.961:19.951:03.34
Hard top, eBay2:25.711:20.991:03.81
Open top, 9LR2:24.021:20.971:03.88

The 9 Lives Big Wang outperforms the cheap eBay wing in every way. In fact, the 9LR wing with an open top out performs the eBay wing with an OEM hard top on any track that isn’t autocross. 9 Lives Racing is a small, made-in-the-USA business with employees who race cars, and you can feel good about supporting them. 

But if you’re racing in 24 Hours of Lemons on a $500 budget, you might find that a cheap wing suits your janky crap-can just fine. The wing could have performed better with more fine tuning, but it’s clearly a case of “you get what you pay for.” If you purchase this wing, you might want to take similar steps that I did to limit movement of the upper wing, optimize the convergent gap and wing angles, and get the wing about 6 feet above your roofline. It is Lemons, after all.

Wing vs no wing

For most of the test I used a 60″ 9 Lives Racing wing, but I wanted to see what would happen without it. The coefficient of drag went down by .03 for all configurations. This is rather interesting, because usually when downforce goes up, so does drag. But this wing had the same drag in all configurations.

When I removed the wing, total downforce took a nosedive, and for the first time in the test, the car generated lift instead of downforce. This was an appropriate time to test the hardtops and see how they did without a wing.

First we threw the Chop Top back on and did a run. Then we attached the rear section, making it into a fastback again. And finally we tested the OEM hardtop. Unfortunately the OEM hard top still had the vortex generators attached, so I’ve made an educated guess on the Total Cl and Cd values below (these are in italics in the table below).

ConfigurationFront ClRear ClTotal ClCdL/D %HP @ 100mph
Hard top, VGs, no splitter, with wing0.18-0.64-0.470.530.8858.75
Hard top, VGs, no splitter, no wing0.220.380.590.49-1.2054.53
Chop top, no splitter, no wing0.110.200.310.48-0.6452.93
Fastback, no splitter, no wing0.160.180.350.38-0.8042.00
OEM hard top, no splitter, no wing

.50.45

What’s surprising here is that without a wing, the chop top has the best L/D ratio. This is largely because it creates the least lift. Remember that negative lift values are what we’re looking for (downforce), and the chop top’s .31 Cl has the least lift. The fastback creates more lift than the chop top, but it does so with less drag, and in the end, this is makes a faster car.

Unfortunately we didn’t get data for a bare OEM hardtop (without VGs, wing, or splitter), so we don’t know if it’s the shape of the OEM roof, or the VGs that create so much lift. But the total Cl value of 0.59 is quite a bit worse than either the chop top or fastback. Based on the data we obtained doing the wing tests, a bare OEM hard top should have a CD of about .45. It’s hard to imagine the vortex generators adding more than 10% lift, and that would put the total lift around .50. 

Let’s see what happens in OptimumLap when we remove the wing. 

Wing or noWatkins GlenWaterford Hills2010 SCCA Nationals
VGs, no splitter, 9LR wing2:25.651:21.121:03.89
Hard top, VGs, no splitter, no wing2:29.141:23.141:04.91

Yikes, that sucks! The wing is worth 3.5 seconds at WGI and even 2 seconds at a short track like Wateford? Amazing.

Now let’s just compare the different tops without wings. 

Tops without wingsWatkins GlenWaterford Hills2010 SCCA Nationals
Hard top, VGs, no splitter, no wing2:29.141:23.141:04.91
Chop top, no splitter, no wing2:27.741:22.851:04.63
Fastback, no splitter, no wing2:26.511:22.421:04.63
OEM hard top, no splitter, no wing2:28.171:22.871:04.80

Here we can see that the fastback is still the fastest configuration, but it’s not a huge difference unless you’re at a high-speed track like WGI. Without a wing, I’d be happy to use a Chop Top at most tracks for the light weight and convenience of strapping in the driver and accessing things like a cool suit, radios, cameras, etc., in the cockpit. And on performance, the Chop Top beats the OEM hardtop, even without factoring in the 38 pound weight difference.

One thing that’s conclusive here is that if the rules allow it, use a wing. This probably even applies to classes like NASA ST6/TT6 that carry a substantial penalty for running a wing.

Airdam and splitter

For most of the test we used a 4″ splitter. This was bolted to a flat undertray, flush with the airdam. I wanted to see what removing the 4″ splitter extension would do. We expected a loss in downforce, but I wasn’t  sure if drag would go up or down. You see it both ways online, with CFD data showing that a splitter reduces drag, and the occasional internet expert claiming that drag goes up. 

SplittersFront ClRear ClTotal ClCdL/D %HP @ 100mph
VGs, splitter, wing-0.20-0.61-0.820.521.5757.58
VGs, no splitter, wing0.18-0.64-0.470.530.8858.75

Score one for the CFD team, the splitter reduced drag slightly. When I removed it, the drag went up from .52. To .53. More importantly, we lost a lot of front-end downforce. Our raw data showed a loss of 69 lbs on the back straight, which calculated to a .38 delta in front coefficient of lift. Let’s see what that’s like in OptimumLap. 

SplittersWatkins GlenWaterford Hills2010 SCCA Nationals
VGs, splitter, wing2:24.321:20.421:03.54
VGs, no splitter, wing2:25.651:21.121:03.89

Obviously, if you’re running just an airdam, and the rules allow it, add the splitter. It’s significant. It’s also worth noting that this was just a plain splitter with no rear curvature or splitter diffusers. Knowing what I know today, the splitter would be twice as effective.

Endurance racing simulations

For endurance racing it’s important to know the amount of energy used per lap, because that determines how far you can go on a tank. You can get this data from OptimumLap simulations. From the energy used, you can determine the length of each driver’s stint, as well as how many laps they can complete in each stint. This can be very important for pit strategy, especially in longer races. Note that simulations are exactly that, and aren’t intended to be exact. But they are useful for making direct comparisons.

The configurations I used for the simulations follow this key. Note that the “B” group has less aero: it uses an airdam, but not a splitter, and no wing.

  • 1a – Open top, wing, airdam, splitter
  • 2a – Chop top, wing, airdam, splitter
  • 2b – Chop Top, no wing, airdam, no splitter
  • 3a – OEM hard top, wing, airdam, splitter
  • 3b – OEM hard top, no wing, airdam, no splitter
  • 4a – Fastback, wing, airdam, splitter
  • 4b – Fastback, no wing, airdam, no splitter

In the table below, the Energy value in the table comes straight from Optimum Lap, and I’ve simply taken a value of 16,500 energy units divided by the energy used to get the number of hours per tank. The Miatas I’ve raced have burned about 7 gallons per hour, so these values aren’t far off.

ConfigClCdWGI LapEnergyHours per tankPit stopsLaps in 8 hours
1a-0.430.43144.029087.531.824174.98
2a-0.530.45144.049141.081.814174.95
2b0.310.48147.749183.121.804170.57
3a-1.010.48142.969223.371.794176.27
3b0.50.45148.179078.141.824170.07
4a-1.20.41141.069031.231.834178.65
4b0.350.38146.518911.281.853174.05

Take a look at the first two, this is the open top vs Chop Top, and it’s interesting that they turn almost exactly the same number of laps. The OEM hard top beats those by a lap and change.

But the fastback configuration 4a is the clear winner here, turning 178 laps, two more than the OEM hardtop with the same aero. Make this into a 24 hour race and the fastback wins by seven laps. Notice the Energy column, the fastback with wing is not only turning the fastest laps, but it’s using less gas than any other configuration, save the fastback without the wing.

In the non-aero B-group, the fastback (4b) wins by three laps over its wingless brothers. This is partially because the fastback can take one less pit stop. If I re-run the data with a larger gas tank so that all configurations have the same number of pit stops, then the fastback wins by only two laps. 

But once you add a wing, the race is over. In fact the worst combination with a wing (open top) beats the best performing top without a wing (fastback) by a full lap, even though the fastback does one less pit stop.

If you want to check my math, I have a spreadsheet with these values, and for simplicity, I’ve removed a lot of the variables in this table. You have to keep track of things like yellow flags and time taken for each pit stop, which determines the actual driving time per race. The 8-hour race I’ve simulated uses 420 minutes of racing time instead of 480 minutes. Yellow flags at Watkins Glen take longer, and I’ve also subtracted 5 minutes per pit stop. 

For shits and grins, the eBay wing again

Let’s see what happens when we use the airdam, splitter, OEM hardtop (without the vortex generators) and the cheap eBay wing. This is configuration 3c in the table below. Look above and compare.

ConfigClCdWGI LapEnergyHours per tankPit stopsLaps in 8 hours
3c.56.55145.719393.391.764172.95

The eBay wing (3c) loses to every configuration that uses the 9 Lives Racing wing. Yup, even the open top car with a 9LR wing is going to be the hardtop with a cheap wing. However, the eBay wing beats OEM hardtop without a wing (3b) in both a sprint race or an endurance race. So it’s worthwhile running a cheap wing if you have nothing at all.

The biggest difference is the Energy field. Compared to the lowest drag version (4b), the eBay wing uses 5% more gas on every lap. That may or may not be a consequence, depending on how long you’re in the car.

It wouldn’t matter in a sprint race; the eBay wing (3c) would win against the fastback without a wing (4b). But in an endurance race, it would depend on the tank size and driving stint time. If I change the data so that they all take the same number of pit stops, then the eBay wing wins. If I leave the gas tank size as it is, then the fastback without a wing wins.

Wind tunnel testing

I wrote an article called The Dunning-Kruger of Car Aerodynamics, wherein I examine the steps most people go through on their aerodynamic journey. It was lucky that I met Jeremiah online and was able to do these real-world tests, and jump right past the pit of despair.

I’m sort of backsliding on the D-K chart by doing wind tunnel testing now, and who knows, I may slide further backwards towards CFD. But in the future, my ‘Busa swapped fastback Miata, Falconet, will have a full onboard system with strain gauges, pitot tube, and all the works so that I can do the same kind of testing I started with.

Back when I wrote this article, I hadn’t done any wind tunnel testing. Since that time, I’ve tested a Miata in the wind tunnel with the full 9 Lives Racing medium downforce kit, as well as everything in their product catalog. In all, I tested a lot of things:

  • Splitter diffusers, spill boards, and tire spats.
  • Canards in various locations and combinations.
  • Closed windows versus open, plus modifications to reduce drag and turbulence from the open windows, including wickers, mirrors, and venting the rear window in two different locations.
  • Singular hood vents fender vents.
  • Brake ducts, NACA ducts.
  • OEM hardtop with and without a rear window spoiler, versus a CCP fastback.
  • Blackbird Fabworx spoiler at different angles/heights.
  • Wings from 9 Lives Racing, Wing Logic, and a couple prototypes.

After payment, you’ll get a link to download the report. It was a lot of work to put together, and so I appreciate the support, it helps this website stay alive, and future testing.

How Aerodynamic Downforce Affects Tires

My twin brother wrote an article on You Suck at Racing about tire grip, and I’m going to steal some of that content to explore how tire grip and aero are related.

Braking, cornering, accelerating: everything depends on grip. Understanding how rubber tires create and lose grip is therefore fundamental. Let’s start with some theoretical laws of friction.

  • Amonton’s First Law: The force of friction is directly proportional to the applied load. If this law is true, then a 4000 lb car should stop in the same distance as a 2000 lb car. It weighs twice as much, but it also experiences twice as much friction, so theoretically, the weight of the car doesn’t matter.
  • Amonton’s Second Law: The force of friction is independent of the area of contact. This means that it doesn’t matter how wide your tires are. Skinny or fat, they have the same amount of grip. And grooves wouldn’t matter either.
  • Coulomb’s Law of Friction: Friction is independent of velocity. Which means you should have the same amount of grip at all speeds.
  • Finally, static friction is always greater than kinetic friction.

You might not believe these laws, because you’ve experienced that tires don’t really follow these laws of friction.

  • If weight doesn’t matter, then why do lightweight cars like Miatas out-handle bigger cars?
  • If tire width doesn’t matter, then why are wider tires faster? And by the same logic, given the same amount of rubber area, why are slicks faster than a tire with grooves?
  • If static friction is always greater than sliding friction, why is it faster to have slip angle through a corner?

Four important graphs

In order to understand how tires work, you have to understand the following four graphs. Introductory physics assumes that the coefficient of friction, Mu (μ), is a constant, and that may be true for a block sliding against a table top, but when it comes to tires, μ is not a constant.

Tires generate grip from molecular adhesion, mechanical keying, and hysteresis, and those factors are based on a combination of variables. In each of the graphs below, the coefficient of friction, Mu (μ), changes due to load, temperature, speed, and slip angle:

Graph A shows μ as a function of load (weight). If doubling weight doubled grip, then the line would be flat. But when you double the amount of weight on a tire, there are diminishing returns. When cornering heavily, the outside tires experience more load, and because of that, heavier cars lose more grip than light cars.

Graph B shows μ as a function of temperature. Every tire has an optimum temperature. Both cold and hot tires have less grip than one in the optimal range. If your tires are too wide, they may never get up to optimal temperature, and a narrower tire may heat up more favorably. For this reason, wider isn’t always better.

Tire Rack did a great test where they tested a bunch of wheel and tire widths. The fastest tire wasn’t the widest. And when they went to a wet track, the fastest lap was the narrowest tire.

One thing that contributes to heat is grooves. Squirming tread blocks are a major source of heat. As a result, grooved tires heat up more quickly than slicks. One reason for using slick tires is to spread the load better, but an even more important one is to prevent the rubber from overheating.

Graph C shows μ as a function of speed. The faster the car goes, the less time there is for keying; the ability for rubber to change shape and interact with the road. Under wet conditions, where adhesion no longer applies, grip is highly affected by speed.

Graph D shows μ as a function of slip angle. Every tire has an optimal slip angle. When a tire is twisted, which it always is to some degree, some parts of the contact patch are experiencing static friction while others are kinetic. This mixed state isn’t really addressed by any of the laws of friction, but it doesn’t make this any less real.

Ian made a drawing of what is happening between the road and the surface of your tire, which can help you further understand how tires grip.

Visualizing grip

The following image shows the surface of the road as a jagged green line on the bottom. (If the road surface was perfectly smooth, then the line would be horizontal. But because asphalt has imperfections with peaks and valleys, the road surface is represented as a jagged line.)

Panel A represents a tire (squiggly line) at rest, pressing into the surface of the road (jagged line).

Panel B is what happens when you add load: the rubber goes deeper into the surface, creating more grip. But there’s only so far you can push the rubber in. This is why doubling the load on a tire doesn’t double its grip. Panel B could also be softer rubber or hotter rubber. In both cases, the rubber conforms more easily to the surface, and with more contact, you get more grip.

Panel C shows what happens at high speed. The rubber doesn’t have as much time to change shape, so it doesn’t deliver as much grip from keying.

Panel D shows what happens when a tire overheats. The rubber comes apart, providing less contact with the surface. If the rubber gets hot enough, it may liquify or sublimate, creating a slippery layer between the surfaces.

This visual model isn’t perfect, as it doesn’t give why slip angle matters so much. But hopefully it helps you visualize the interface between your tires and the road, and why some factors add grip, and other factors take it away.

Aero and tires

So that’s how rubber grips the road, but there are other dynamic factors at play here, namely the aerodynamics of the vehicle.

Most cars without aero lift at speed, because the curved surface of the top of the car is longer than the bottom. In other words, cars are shaped like airplane wings, and like wings, they generate lift. The higher the air speed, the less traction there is.

Most cars have a coefficient of lift of around 0.3. Cars with a lot of curvature, like a fastback, have more lift than a three-box sedan or hatchback. By nature of their shape, most cars generate more lift over the rear tires than the front tires.

Cars also generate lift when in yaw, so if your car is pitched slightly sideways in a corner, it has even less traction. Nissan did some tests on this and found there is a fairly linear relationship between yaw angle and lift, and so the more sideways you get, the more the car lifts.

This means as you corner faster and faster, your rear tires have less and less rear grip. You already saw in graph C and panel C that tires have less grip at speed because they have less time for keying. So if you combine the keying losses with the lift and yaw losses, you get a car that’s lost a lot of grip on the rear tires.

And this is why it’s so important for race cars to have spoilers and/or wings.

Aero and lap times

To put some numbers on it, let’s take a look at a few NASA classes at Watkins Glen.

NASA Spec3 is a class for stock-bodied (no aero) E36 BMWs on Toyo RR tires measuring around 14.5 lbs/hp. The Spec3 lap record is 2:13.6.

NASA also has the ST5, class, which is a similar lbs/hp ratio to Spec3, but allows a splitter and wing. The ST5 record is 4.3 seconds faster: 2:09.27.

NASA also has a time trial class, TT5. TT5 and ST5 are the same formula, but the ST5 cars are racing wheel to wheel, whereas the TT5 cars are in a time trial situation with less traffic. Therefore, the TT5 laps are usually faster, but in this case, a surprising two seconds faster: 2:07.202.

If you compare the Spec3 lap record to ST5/TT5, can see that aero (splitter and wing) are worth about 4-6 seconds at Watkins Glen. Let’s call it 5 seconds for simplicity. This isn’t a difference in tire grip, as most cars are on Toyo RRs, but some cars are on Maxxis RC1 for the same lbs/hp (or Hoosiers at a significant penalty to lbs/hp).

Let’s take a look at where the difference is. On the front and back straights, there isn’t a huge difference in top speed, so the cars are pretty similar in lbs/hp. In Turn 7, where aero doesn’t make much difference, the minimum corner speeds (vMin) are pretty similar, and so we’re looking at cars with equal grip, as well. But take a look at Turn 10, the aero cars are going about 10 mph faster!

LapFrontBackT7T10
Spec32:13.61211266287
ST52:09.311812776396
TT52:07.21231286298

Now I’m making some pretty big assumptions on driver skill and track conditions being equal. So I’ll do some simulations in OptimumLap, and see if the computer world agrees with the real world.

I’ll start with the Spec3 car using drag and lift values of .44 and 0.3 which is probably in the right area. With these values I get a lap time of 2:13.82 which is pretty close to the Spec3 lap record. I’ll then add a splitter and wing to bring the Cd to .47 and Cl to -0.8 which are pretty fair values for the added aero. Doing only these aero mods on exactly the same car, I get a 2:08.84 lap, which is right in the middle of the 5-second delta we saw in the real world.

So that’s a pretty good verification of aero being worth about 5 seconds. So next I want to take a look at Turn 10 and see how much aero helps here, and if there’s really a 10 mph delta.

Turn 10 Watkins Glen

For the OptimumLap simulations, I’ll use four cars instead of two cars to get more granularity. I’ve given them the same tires with 1.2g of lateral grip, but different aero packages.

  • No aero – This is the Spec3 car with a coefficient of lift of 0.30, and is represented by the red line.
  • Zero lift – This car has some minor aero like a spoiler, which cancels out lift, and so the Cl is zero. This is represented by the orange line.
  • Mild aero – This is the kind of lift and drag you’d see from a spoiler and airdam done professionally (NASCAR level). This is represented by the blue line.
  • Good aero – This is a car with a splitter and wing, and is represented by the green line.

I’ll examine the grip in the middle of Turn 10, at the 16000′ mark from the start/finish line. This is not quite the minimum speed in the corner, but shows a high lateral load and is as good a place as any to look at G forces. There are a lot of spikes in the graph (like you’d see in Aim Solo data), so imagine it’s more of a smooth arc.

Lateral Gs in Turn 10 on the same tire.
  • Starting at the bottom of the graph, notice that the car represented by the red line is pulling only 1.14 Gs. Recall that I gave all the tires the same 1.2g of grip, but because of aerodynamic lift, they are losing traction at speed. This is a normal situation for a street car or spec racer with no aero. What the simulation doesn’t show is that most of the grip is lost on the rear tires.
  • The orange line is a car with a spoiler, which mostly cancels out lift. Lateral Gs are very close to the the static 1.2g value.
  • The blue line has more than 1.29g grip because tire load is increased with downforce.
  • The green line is even more dramatic, with 1.4G grip. This is significantly more grip than the car with no aero.

You might be wondering how an increase in lateral Gs plays out in speed through the corner, which is the next graph. I’ve chosen the same 16000′ spot on track to measure the speed, and you can see it’s a difference of almost 10 mph between fastest and slowest.

Turn 10 is a very fast corner, and you’d see a smaller delta on a slower corner, but this is still pretty remarkable. By increasing the load on the tires, tire grip went from 1.14 to 1.4 Gs, and the car with good aero went about 10 mph faster in the middle of the corner.

Downforce and tire wear

Most people imagine that aerodynamic downforce will make your tires wear out faster. More grip = more wear, right? No. Oddly, downforce makes tires last longer.

Tires wear by abrasion; from sliding or spinning. Have you ever flat spotted a tire? Then you know that sliding a tire can wear it out in a couple seconds! Aero increases the load on the tire, giving you more grip, which makes it less likely to spin or lock up.

Aerodynamic downforce also loads the tires more equally. When cornering, the outside tires get loaded more, as a normal byproduct of mechanical grip. However, aero loads are based only on air, and is balanced across the car, left to right, helping to balance the car better.

One could even imagine an active aero device that would split the wing in half and only load the inside tires. Or rudders or vanes that help the car turn using air alone, and use the tires even less.

But let’s jump back from fantasy land… in reality, you get more aerodynamic downforce from rear aero than front aero, and this helps a lot in braking zones, increasing rear load and rear grip. The same is true in acceleration, and more rear grip reduces tire wear (on rear wheel drive cars).

Another way aero increases tire life is when you drive under the limit of the tire. For example, take Turn 10 at Watkins Glen again. Miatas can usually go through at full speed or with a slight lift on entry, and that’s because there isn’t much of a straight between Turn 9 and Turn 10 and Miatas are dog slow. If you’re going through at 85 mph without aero and on the limit of traction, you’ll go through it with aero at the same speed, but well under the limit, and you’ll wear the tires less.

The uphill esses are another place where a Miata is flat out while cornering. You can’t ever reach the limit of lateral grip because the car can’t accelerate fast enough to get there. So you slip less and use less tire.

Now this isn’t going to be true at every race track, most of the time when you have a higher limit, you fuggin use all of it. But sometimes there’s a corner or two where aero now puts you under the limit, and in a long endurance race, this can be the difference between changing tires mid race, or simply saving money. The point being, aerodynamic downforce can make your tires last longer if it keeps your car from sliding.

A good real-world example is the 2000-2002 Corvette SCCA cars, which went from a 315 rear tire in 2000 to a 275 tire in 2001. To increase grip, a rear wing was added in 2001, but it wasn’t enough and tires would only last about 4 laps before starting to go off. After optimizing the aero in a wind tunnel to create more downforce, the same tires in 2002 would last an entire race.

Aerodynamic balance

At this point I’ve only looked at how aerodynamic downforce affects grip and longevity due to increased tire load. But there are other aero factors at play that are important.

Earlier in this way too long blog post, I by mentioned that cars without aero lose rear grip from lift and yaw. In truth, the car loses both front and rear grip, but it loses more rear grip. As a consequence, as the car goes faster, it transitions more and more to oversteer. Most people find this an unsettling situation.

Personally, I don’t mind if a car oversteers at low speed, in fact, I like it. But if it does that at high speed, it scares the shit out of me. Ideally, I like a car that rotates easily at low speed and then transitions to understeer at high speed. This is ridiculously easy to do: add a big wing, and then tune the amount of understeer by adding or removing wing angle.

This is the magic of dynamically balancing the load on your tires using downforce. It’s so easy, and it’s so tunable. However, rear wings and end plates also increase stability by increasing the static margin.

Static margin is the distance between the center of gravity and the center of pressure. Anything that adds rear drag increases the static margin, sort of like streamers on a kite tail. In addition, horizontal areas on the back off your car, like big end plates, shark fins, or even bodywork like a hatchback or station wagon, increases the static margin through sideways resistance to air.

A greater static margin makes the car harder to turn, but also makes the car more stable. When a car goes over the limit of grip, the driver must make steering corrections. Cars that have a higher static margin require fewer steering corrections to bring the car back into line, which is easier on the driver. This also ends up being easier on the tires, and can make the car faster, if a bit less exciting to drive.

Conclusions

Tire grip is arguably the most important factor on a race car. Understanding how tires make grip is therefore one of the most important things a racing driver needs to know. Aerodynamic downforce can greatly influence the balance and grip of the tires at different speeds, and can be used for tuning the car’s handling and ultimately make the car turn faster lap times, and/or stay on track for a longer duration.

Miata Spoilers

If you’re serious about downforce, use a wing; it can generate more downforce, and is more efficient than a spoiler. It begs the question, why would anyone want a spoiler?

  • Spoilers are usually cheaper than wings.
  • Some racing rules don’t allow wings, but allow spoilers.
  • A small spoiler can reduce both drag and lift.
  • Wings are often gaudy on a street car, but spoilers almost always make a car look cool. Not only my opinion, but NASCAR fans as well.

I tested a Blackbird spoiler in the wind tunnel, and it performed much better than I expected, and in some ways, better than a wing. You can read about that in my Miata Wind Tunnel Report. I finally had an opportunity to test my large-chord, small wingspan S1223 wing in a wind tunnel, as both a single wing and as a dual wing. The results were not what I expected. I go over all of the details in my Miata Wind Tunnel Report, which is available for $35.

I didn’t just test spoilers, I also tested several wings, splitter diffusers, spill boards, tire spats, canards, hood and fender vents, NACA ducts, brake ducts, and even a fastback, which has a built-in spoiler. You can read about all that in the report, but let’s get back to the topic on hand, which is Miata spoilers.

How a spoiler works

Cars are basically shaped like airfoils, and as air moves over them, it creates lift. The faster the car goes, the more lift and instability is generated. A spoiler, as the name implies, “spoils” the airflow coming over the top of the car, fooling the air into behaving as if the car has a different profile. This cancels some lift, and often reduces drag as well.

A spoiler also concentrates high pressure air on the rear deck lid. Pressure is akin to weight, and so this adds downforce to the rear of the car.

A spoiler also moves the center of pressure rearwards, and like a streamer on a kite, this promotes stability.

Spoiler height

How high should a spoiler be? Let’s take a look at what the pundits say. In Race Car Aerodynamics, Katz shows two different graphs for spoilers. The first is based on spoiler height alone, at a fixed angle of 20 degrees from vertical, or what I’d call 70 degrees.

I’ve put some pencil marks on the graph and drawn some conclusions.

  • A low spoiler about 1″ tall reduces drag the most. It also adds a bit of downforce. From a drag and downforce perspective, it’s a win-win!
  • A 3″ spoiler doesn’t add drag (compared to no spoiler), but doubles the downforce of the low spoiler. In other words, you get something for nothing!
  • A taller spoiler adds downforce and drag, but downforce increases more rapidly than drag. The gift that keeps on giving!

So no matter what height spoiler you chose, it has a benefit. Based on theory alone, we should all have low spoilers on our street cars, and taller spoilers on our race cars (rules permitting).

Note that the previous image shows a loss of front downforce at all spoiler heights, but in my testing, spoilers have increased front downforce by a very small amount.

Spoiler angle

Katz includes another graph on spoiler angle, this time using a fixed-height spoiler. Confusingly, this time the angle is measured from horizontal, not vertical, and the 70-degree angle from the previous graph isn’t included.

Some observations of this data:

  • Drag increases fairly linearly with angle (meaning height).
  • Lift-drag ratio seems best at a very shallow angle, but this may simply be the low overall height of the spoiler. Also note that L/D ratio is at best 3:1, whereas in my testing I’ve seen 11.5:1 L/D ratio using a 5” spoiler on a Miata.
  • Increasing spoiler angle to 60-degrees or more increases downforce, but at a diminishing return.

Spoiler height and angle combined

Next I’ll look at my other favorite reference, Competition Car Aerodynamics. McBeath cites CFD work done on NASCAR spoilers, in which they changed both the spoiler height and angle. Now we’re getting somewhere.

I’ll use the above results to compare spoilers of different lengths and angles that result in a similar total height above the deck. Which in turn allows me to figure out the most efficient spoiler angle.

  • 160mm spoiler, 20 degree angle, 54.7mm total height
  • 80mm spoiler, 40 degree angle, 51.4mm total height
  • 60mm spoiler, 60 degree angle, 52mm total height

It’s a bit difficult to see in this graph, but a 60mm spoiler set at 60-degrees is slightly better than a 160mm spoiler set at 20 degrees, even though the longer spoiler is a little bit taller. In other words, a higher angle works better. But it’s only by a small amount.

Based on Katz and McBeath, here is my simplified conclusion: The total height of the spoiler is the most important factor, and the more vertical, the better.

NASCAR spoilers

NASCAR used rear wings for a short period of time and then switched back to spoilers. Not because they could get better performance from a spoiler, but because the series is always looking for ways to make racing both closer and safer, and the wing did neither. In addition, the fans didn’t like the look of a wing. To be fair, the CoT wing was hideous, see for yourself.

Yuck.

So we can’t look to NASCAR for the most effective spoiler design, because we know their priorities lie in close racing rather than outright speed. But it’s worth noting a few things about NASCAR spoilers.

  • NASCAR probably knows more about spoiler design than any other race series, and they still don’t settle on one design. In fact, the regulations change almost yearly. Looking only at the height, in 2016 it was 3.5″, in 2017 2.375″, and in 2019 8″.
  • Some years the spoilers were adjustable for angle, some years they were fixed, and there have been different heights, widths, and shapes throughout the years.
  • NASCAR uses the spoiler to balance not only the overall aero package, but as a way to balance the performance between different cars, and at different tracks.
  • When NASCAR reverted from rear wings to spoilers, they set the spoiler angle at 70 degrees. In 2019 the fixed angle remains 70 degrees. Interesting.

Here’s an excellent article on A comparative look at NASCAR’s new spoiler, old spoiler, and wing.

Nscs-newspoiler2010hi_medium
Click image to enlarge.

NASCAR spoiler shapes

The 2019 spoiler is flat across the top, but different shapes have come and gone.

Image result for nascar spoiler shape
Curvy, almost bat-wing style.
Image result for nascar spoiler shape
Convex top edge.

The size and shape of Miata spoilers

So now that we’ve looked at spoiler theories and real-world examples from NASCAR, let’s get down to what matters: Miata spoilers.

  • Miatas have a roofline that is peaked in the middle, and you might imagine that the ideal spoiler shape has a matching convex arc to it. Although like all things aerodynamic, this could be totally false, and maybe the sides should be taller.
  • The rear edge of the trunk is curved and so a curved spoiler would look more natural, and could be an easier DIY project as well. Also, a curved spoiler would be more rigid than flat. However, some race series say that the spoiler must be flat, with no curvature. Booo!
  • There’s no reason to “spoil” the air coming along the sides of the car, and so a spoiler much wider than the rear canopy seems like a waste. Although the exposed spoiler ends are probably adding downforce. Albeit not very efficiently, and at probably a different angle than is ideal for spoiling the roofline shape.

Miata products

This IKON spoiler is an attractive design, with a convex top edge and curved profile. It would be neat to see something like this with a flat extension that’s adjustable for height.

The Rocket Bunny spoiler is flatter across the top, taller, and with a steeper angle. I’d guess it’s slightly more effective than the Icon, but it has a tacked-on look that doesn’t really appeal to me.

And then there’s this JSP spoiler that looks like a wing, but isn’t (air isn’t going to flow under it, hence not a wing). The shape follows the curvature of the sides and roof, and this may be an efficient design. But meh to the looks.

Of course all of these spoilers have a fixed height and angle, so there’s no way to adjust the aerodynamic balance. On the other hand, the Blackbird Fabworx spoiler is large and adjustable for angle. I’m also not a huge fan of the way this one looks, but the beauty lies in the function.

Spoiler done right.

DIY spoiler, testing height

I made my own spoiler, it’s about 3.5″ tall and has some curvature to it that follows the trunk shape. It’s made of plywood and fiberglass, and there are 6mm T-nuts so I can add an extension.

With the low spoiler (without any extension), I ran very consistent 1:22s at Pineview Run. And by consistent, I mean 1:22.03, 1:22.05, 1:22.07, and in my second run, 1:21.99, 1:21.99 and 1:21.93. This was a hot day, and if I compare the times to previous ones, the track was definitely slower than normal.

With a 3.5″ extension (total 7″ height), my lap times were less consistent, most of them around 1:21.5, but my fast lap was a 1:21.03, almost a full second faster. But that one was an outlier, and if I average the five fastest laps, the taller spoiler was about .55 seconds faster than the lower spoiler.

The following table is an average of four back-t0-back runs, two with the spoiler extension, and two without. I’ve averaged the top six fastest laps.

ConfigurationAvg LapSimulatedHPLbsCgCdCl
Low Spoiler1:22.01:21.1111224001.00g.44-0.25
Tall Spoiler1:21.451:20.6311224001.00g.45+0.20

I added .01 to the Cd as a guess, but drag isn’t that consequential anyway. I came about the Cl figure by changing that value in OptimumLap until I got the .55 delta in lap time. It seems absurd to think a spoiler can make a .45 swing in Cl, but that’s what the simulation says. Interestingly, this is also the value cited for a 8″ tall spoiler in MacBeath’s Competition Car Downforce.

In Race Car Aerodynamics, Katz cites several examples of spoilers, but none that go as high as 7″. In his examples, the relationship between height and coefficient of lift is nearly linear, and from 0″ to 4″ there’s a change of about .4 in Cl. So if I extrapolate those values from a 3.5″ spoiler to 7″, I’d only expect to see a change of .4 Cl, which is again pretty close to the test result.

Whatever the case, a 7″ tall spoiler works on a Miata. Now I have to make a taller one and test that.

Downforce Versus Drag

I have two Miatas, and even my faster one is slow. Adding an airdam, splitter, side skirts, wing, and all the other aero bits add weight, and some of them increase drag as well. The last thing you want to do to an underpowered car is add more weight and drag, right? Maybe.

Drag reduction matters most when accelerating on a straight, but pretty much everywhere else downforce is preferable to drag reduction. Even still, there are times when drag reduction is more important, such as in an endurance racing strategy where you want to do one less pit stop. It also seems logical that at a high-speed track you’d want to skew your aero package towards top speed and reduced drag, especially in an underpowered car.

Or so you’d think. But like most things aerodynamic, what seems obvious could be completely wrong. So let’s examine downforce vs drag on a very fast racetrack that is dominated by long straights and top speed.

I did a motorcycle track day at Portland International Raceway, and I’ll describe it like this: it has a really long and boring front straight, a couple corners, another long and slightly less boring back straight, and a couple corners. If ever there was a track where you’d want to reduce downforce and optimize for less drag, this is probably it.

In Race Car Aerodynamics, the author Joseph Katz calculated lap times for a generic prototype race car at Portland International Raceway factoring in grip and drag. Take a look at the track layout in the chart inset, it’s like I said. The full results are in SAE Paper 920349, but this is what I make of it.

At this track, you might think that you should set your aero for the least possible drag, thereby attaining the highest top speed. But that actually sets the worst lap time, some 6 seconds off the pace. Or you might think to optimize for the highest L/D ratio, and with that you’d at least be within the same second as the fastest cars.

But somewhere in the neighborhood of maximum downforce, that’s where the fastest lap time was. On any other track I’d guess that maximizing downforce is the right thing to do, but I’ve raced down the front straight on this track (which is nearly a mile long), and the results are surprising.

This is a calculation, albeit a very sophisticated one, and it’s based on a race car with a lot of power that can overcome drag. Still, it makes me wonder if we should chase all the downforce we can and not worry about drag reduction at all. Miatas are all about cornering anyway, and we’re used to getting passed on the straights!