Miata Is Always The Answer for a lot of reasons, but aerodynamics isn’t one of them. The convertible top means the canopy is shorter and wider than a purpose-built coupe or fastback, and the result is more drag. Case in point: Wikipedia lists the 1993 Mazda RX-7 at a drag coefficient of .29, while the Miata of the same year was .38. (I explored how a RX-7 bodied Miata would perform in a blog post, Miata vs RX-7 Aero.)
The top isn’t the only problem, but a front end that is more cute than functional. The shape of the nose directs air under the car and at the exposed tires. The front got better with each generation, but the convertible top meant airflow over the roof would always be a problem. While that isn’t an issue on a street car, how air interacts with the body is important when racing. Racing improves the breed, and as everyone knows, Miatas went racing!
Unfortunately, the rampant popularity of Spec Miata racing did nothing for Miata aerodynamics. Except delay it. There was a lot of aero experimentation going on in other series, especially in time trials, but then along came Emilio Cervantes’ brainchild Supermiata, and with that came a more homogenized look of what a track Miata should look like. It wasn’t much more than a vertical airdam and spoiler, and in the faster turbo class, the addition of a splitter and wing. The aero package addressed the most critical aspects of Miata aero, except the roof.
The aftermarket turned out lighter hard tops, but not much in a different shape. Fastbacks are rare in the aftermarket, and the DIY versions are as individual as their designers. And because of that, fastbacks are hard to quantify. Look at the rulebooks of various racing organizations and a fastback could put you in an unlimited class, or give your car a large penalty, or virtually none at all. The one thing you can glean from all this is that nobody really knows what a fastback is worth.
Unravelling that mystery is how this whole aero test started, but it morphed into something more when I caught wind of a David Murry track day at Watkins Glen International. Run as a 7-hour open track with no run groups, this two-day event would allow me to swap parts, make adjustments, and investigate more than just different tops. The track is only 25 miles from my house, and a plan began to materialize.
Drumming up interest
I don’t engage much on internet forums, but posted one called Real-world Testing on the Aerodynamics section of Miata Turbo, stating my intentions, and trying to garner interest from real Miata enthusiasts. The responses were snarky and condescending, which is normal for MT. But through this chaff I met Jeremiah Wennermark, who runs a business called Man and Machine Consulting. We struck up an online relationship and made some tentative plans for June.
I emailed Grassroots Motorsports magazine and told them I was doing this test, and would they be interested in an article? I mentioned that I was a motorsports editor and staff writer (Moto-Euro magazine) for four years, and that it would be a solid piece of writing. They would have to shorten it and clean up the profanity, natch. The only thing I asked for in return was a GRM hat.
GRM editor David S Wallens was initially interested, albeit a bit skeptical, and over the next five months I’d send him the occasional progress report and to see if he was sending anyone, and to gauge his interest level. To make a long story short, he never said yes or no, just kind of strung me along, and this includes even after I sent him the completed article, which I’ve still never received feedback on. I guess GRM has more interesting things to publish, like how to paint your car, or press intros for the new Supra, Corvette, or whatever. Personally, I don’t care about that shit, I race cars at the grassroots level.
A GRM article would have been a nice feather in my cap, but there are advantages to doing this online instead. I can update the article from reader feedback, fix the inevitable errors, and I’m not constrained by length or the occasional F-bomb. And maybe I’ll do a Part 2 of this test next year, and just keep adding to the data.
The playing field
Before you read any further please agree not to write me and say “you should have tested this or that.” Weather and other factors meant I didn’t get to test everything I wanted to. Something always comes up, shit breaks, unforeseen things happen, that’s all part of playing in the real world. I brought a lot of parts that never left the truck. Still, some internet pundit with no skin in the game is going to puff up and say I did this or that wrong, and dump a pile of “shoulds” on me. Fuck you.
An important part of unbiased testing is that you aren’t influenced by manufacturers. I paid for everything at full retail price. Also worth noting is I don’t sell aerodynamic parts. This was entirely an intellectual pursuit, not the start of a business venture.
I’m going to reference OptimumLap a lot. It’s a free simulation program that allows me to change various factors and compare the results. It’s not intended to be 100% accurate, but useful for comparisons. I’m going to use the same car (my Miata) and change only the aerodynamic lift and drag fields.
Before we get to the data, let’s level the playing field. If you’re familiar with drag and lift figures, you can skip ahead, but for those of you who need a nerd alert, here’s what the values mean.
- Coefficient of lift, abbreviated Cl, is how much aerodynamic lift the car generates. A negative number means downforce, which is good. A positive number is bad. (In OptimumLap, these values are reversed: positive is good, negative is bad.) Coefficient of lift is measured at the front wheels, and the rear.
- The Total Cl is both front and rear ends added together, and is a good way of looking at comparing different configurations. Often a gain at one end is offset by a loss at the other, because the car tilts forward (positive rake) or backwards (negative rake).
- Coefficient of drag, abbreviated Cd, is how streamlined the car is. A lower number is better. If you’re familiar with published Cd values and my data seems high to you, it’s because all of the tests were done with the windows open, and in the real world.
- Lift-to-drag ratio, or L/D %, is the amount of lift generated by the vehicle, divided by the drag. The higher the value, the more efficient the vehicle is at creating downforce.
- HP @ 100 mph should be obvious. Our car had 120 hp, and so the lower the number, the more horsepower remains at that speed.
Sensors, data, and Jeremiah’s genius
After initially meeting Jeremiah on Miata Turbo, we exchanged Google docs and spreadsheets, and through those I got to know him. I soon realized he was the real deal, a total genius, and he makes me feel like the hack that I am. Jeremiah’s portable travel kit consists of two large cases with $23k worth of sensors and monitoring equipment that he can bolt on to any car. It’s pretty amazing.
To get environmental data, Jeremiah started by mounting a pitot tube on the nose of the car to measure dynamic air pressure. Coupled with sensors inside the car to measure barometric pressure, ambient air temperature, and relative humidity, he can normalize all the factors between runs. This was crucial to our testing, especially when we suddenly got an 11 mph headwind while testing two different wings back to back.
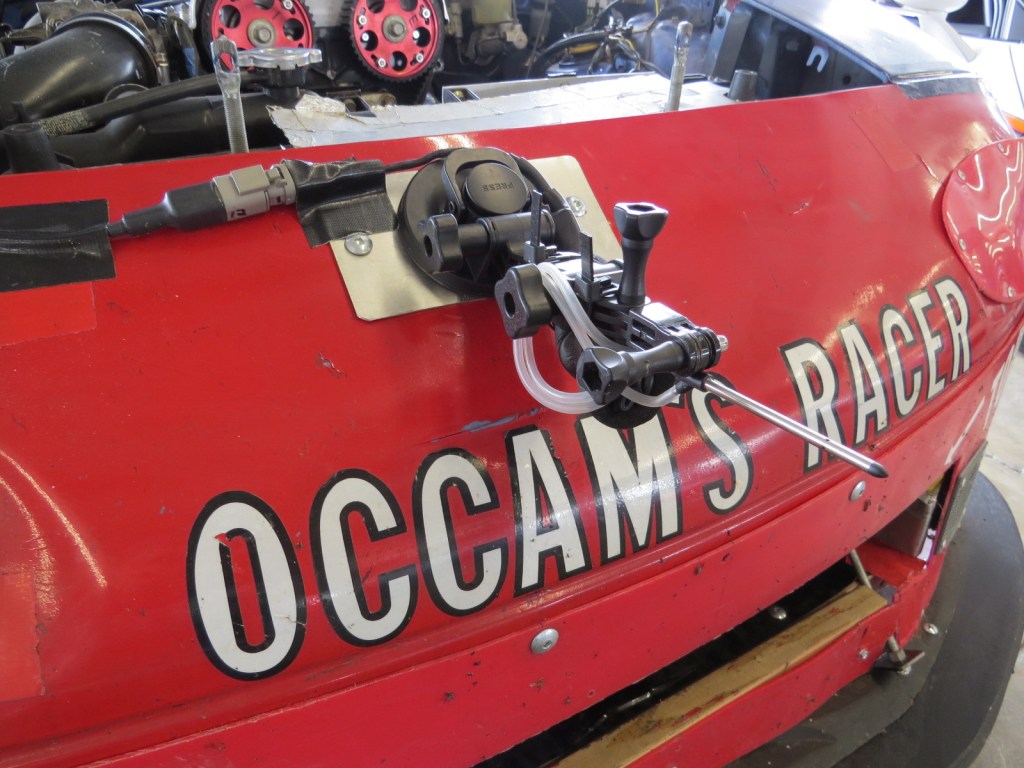
The environmental data is sent through an analogue CAN bus signal converter, and allows Jeremiah to make any flat road into his own wind tunnel. But unlike many consumer accessible wind tunnels, he measures the real effect of rolling tires across asphalt. In fact, during one of the many on-track delays, we used the parking lot for the rolling resistance test.
To measure suspension position, he installed both linear and rotary potentiometers on the suspension components. Even more trick, Jeremiah designed custom load cells that install quickly beneath the coil springs. These flat metal discs contain sensors known as strain gauges that change electrical resistance as weight is applied to them. Temperature sensors on the strain gauges compensate for that variable, as well. The combined data is then amplified and sent to the CAN bus. All told, everything the suspension is doing at every point on the track is logged, and importantly, this includes how much downforce the car makes at various speeds.
All of that information is sent through a wiring harness that resembles a spinal cord, both in thickness and complexity. Built by hand, Jeremiah spent over 50 hours laying the tefzel wire in a concentric pattern using autosport and DTM connectors, raychem sleeves, ATUM connector booting, and terminated wires using a DMC turret crimp tool. All which is accompanied by an OEM-like wiring diagram and pinout sheet.

The spinal cord connects to the brains of the system, a Motec C185 enabled for advanced onboard math functions, additional logging memory, display creator, and additional inputs. The data logger is used in conjunction with Motec i2 Pro and Matlab for analysis.
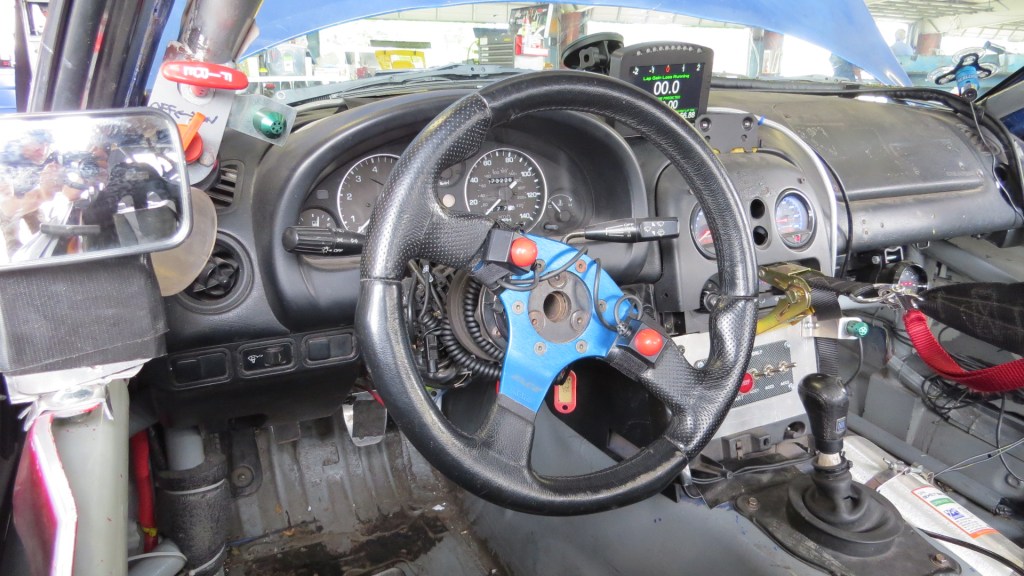
In the cockpit, Jeremiah installed push-to-talk buttons on the steering wheel for driver confirmation of coast down and quasi-steady state test initiation, and a Motec dash display for air speed, GPS speed, etc. He also installed a Racelogic VBOX dual-camera GPS logging video system, which would allow us to compare what our drivers were doing on track, based on their location, rather than lap time.
Setting up the test mule
All of that expensive hardware went on a run-of-the million Spec Miata, originally part of Rosmar Racing’s rental fleet. It’s been modified with a cold-side intake, header, and Megasquirt PNP2. Berg Racing of Webster NY tuned the engine conservatively for endurance racing, and it measured 120 hp on their Mustang dyno.
The exterior has also been modified beyond Spec Miata rules and resembles what a lot of other tracked Miatas look like these days. The front has a vertical Supermiata style airdam, but with a removable 4” splitter extension bolted to the underside. The car also has side skirts with wheel spats, vents on the back of the front fender, and no rear bumper.
I made my own aluminum wing stands holding up a 60” 9 Lives Racing wing. (The normal width for a NA wing is 64″, but I plan to experiment with an end-plate supported wing bolted to the bodywork, and that would be too wide.) I set the wing angle at 5 degrees AOA, but because of negative chassis rake, the actual wing angle measured 4.6 degrees. The wing is mounted at roof height, with 12” x 12” end plates, and no Gurney flap.
The day before the Watkins Glen test, we brought the car to Pineview Run Auto & Country Club, a private race track in Central NY. CEO and Founder, Todd Milton, is no stranger to racing cars or aerodynamics, he raced dirt track and experimented with aero before CFD and the internet made it much easier. So when we told Todd about the tests we were running at Watkins Glen, he was gracious enough to let us use his entire facility for a private pre-test day.
The Pineview Run racetrack is a 1.1 mile rollercoaster of 2nd and 3rd gear corners. Not the ideal venue to test high-speed aero, but a great place to get our drivers familiar with the car, set up acquisition, and shake down the kinds of problems that only occur on track. There were minor clearance problems with one sensor, and other small adjustments to be made. It didn’t help that it rained, a theme that would persist throughout the three days. We finished setting up the car just in time to load the car up and literally race the RV and trailer over to Watkins Glen, arriving just two minutes before the gates closed for the evening.

Watkins Glen testing
Watkins Glen is a good place to test aerodynamics, not only because of its high speed, but the back straight is long, and flat enough to correct for the small gradient, making repeated steady-state and coast-down tests possible.
To make sure all the measurements were taken exactly, Jeremiah used a laser and shims to correct for any slope in the garage floor, and marked the exact spot where the car would be measured before and after each run. Garage 23B at Watkins Glen has a 1-degree slope. This allowed Jeremiah to take repeated measurements on things like wing angle, splitter angle, rake, etc.
Our driving team consisted of two drivers, who would provide both subjective feedback, and run the manual tests on the back straight. Our first driver, Anthony Zwain, knows his way around a race car and the track, and has a recent ST3 lap record at Watkins Glen. Zwain owns EDGE Motorsports in Mountain View, California, a maintenance and performance shop for BMW, Porsche, Mini, and Subarus. Our second driver Alyssa Merrill is a young, local hotshoe, with experience racing Miatas at the Glen.
We wanted to let our drivers loose to get their opinions on how the car felt, and also get data on top speed and fastest lap times. But it didn’t go exactly like that, because it was more important to get the static speed and coast-down tests done first.
The regular test procedure was to reach 90 mph on the back straight, and then hold in a button on the steering wheel while maintaining steady state conditions. The data was logged constantly, what the button-press did was initiate tell-tale averaging math functions in the Motec dash, expediting the data analysis upon return to the garage. After a few seconds, the driver would disengage the clutch and transition into the coast down test, gradually letting drag decelerate the car to 70 mph. Most of these cars with 500 hp or whatever were already blazing by us, so you can imagine the speed differential when doing steady-state and coast-down tests.
To calculate drag, you have to factor in the effective mass used while generating drag force values, which Jeremiah compiled from the vehicle’s static weight with driver, and additional dynamic weight due to wheel, tire, and brake disc inertia. He then factored in the rolling resistance, and measured the frontal area with each configuration, which gives the corrections for the final drag resistance values. (Note that we used 225/45-15 Hankook R-S4 tires on 15×9 ET35 wheels for the rolling resistance test.)
During the test we did our best to make everything as consistent and repeatable as possible, but there are always factors out of one’s control. For one, in central NY the only thing predictable about the weather is that it isn’t. It was dry, it was wet, it was often in between, and twice the track was closed because the corner workers couldn’t see each other through the fog!
Temporary track closures are something you can count on at Watkins Glen. The track has steel armco guardrails instead of run-off areas, so off-track excursions are announced with a loud BANG, and result in a very second-hand looking car with brand new racing stripes, in Watkins blue. Next they shut down the track to bring out the sweeper, tow truck, and sometimes a repair crew for the armco.
Between the iffy weather and track closures, we only got about half way through our testing program. Significantly, we didn’t get to test different front ends. We had a stock front end on hand, as well as a R-package lip, and we wanted to see how those compared against the airdam and splitter. Alas, when someone hits the wall at Watkins Glen, everyone pays the price.
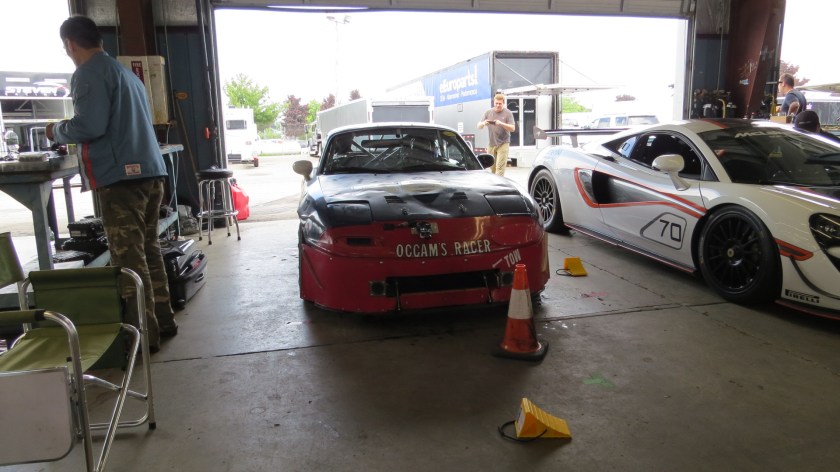
At this David Murry Track Day, oh what a price. Most of the cars were quarter-million dollar exotic supercars, and that’s before you add the race kits, spares, stacker tow rigs and crew. We shared the track equally with race cars from Ferrari Challenge, Lamborghini Super Trofeo, IMSA, and even some open-wheel racers.
Jeremiah joked that a single wheel from one of the cars might be worth more than my entire car. He was only $1000 off. If you have that kind of money, you can throw that kind of money. At least five times over the weekend one of the exotics would “earn their stripes,” broadcasting carbon fibre confetti as if it were crop seed.
So when you show up to such a track event with a beater Miata, it’s important to one-up them with your skill and professionalism. Our multiple computer monitors and data acquisition setup served them their first notice.

We then made sure to leave the hood pins unlatched in our first run, and the hood opened violently just after pit out. Thankfully there’s a small gap under the hood that our driver could see through, so we didn’t have to close the entire track down for a tow.
We also got lucky that the windshield didn’t break. This good fortune allowed us to do a full parade lap with the hood smashed flat against the window, our statements on skill and professionalism now made with authority. Perhaps the car gods looked favorably upon this humble tribute, because after repairing the damage using parts donated from the parking lot, the remainder of the two-day test proceeded without incident.
So now that I’ve given you the who, when, where, why, and how, let’s get to the what. You can see the graphs and details in the Test Results menu and links within, but here are some quick conclusions:
- Adding a 4″ splitter to an airdam reduces drag slightly, (.o1 Cd) and adds a lot of downforce (.38 Cl).
- If you race with an open top and a wing, it’s faster than an open top without a wing. However, an OEM hard top helps the wing generate 250% more downforce than an open top.
- My fastback measured 17% less drag than an OEM hardtop. When used with a wing, the fastback generated 130% more rear downforce. In other words, the 60″ wing behaved as a 78″ wing, but without any more drag.
- Don’t use vortex generators, particularly if you use a wing.
- A cheap dual-element wing created a lot of drag, but also created a decent amount of downforce. Using one is faster than not using one.
- The 9 Lives Racing single-element wing made less drag and more downforce than the cheap dual wing. By a lot.
