Professional aerodynamicists mostly work in terms of coefficients. When they converse with each other, they talk in terms of points, decimals, and percentages. When I started writing about aerodynamics five years ago, I also worked solely in terms of coefficients. Not because I’m qualified to do so, but because I’m a cheap bastard who uses a free tool for racing simulations.
The only way I know to quantify lap time differences in aero setups is to use OptimumLap, and it requires coefficients for inputs. Thus, when I published the results of my aero testing at Watkins Glen in 2019, it was all numbers that were perhaps difficult for the average person to understand. I probably lost readers who don’t think in those terms.
These days I try to report things in pounds of downforce. I usually cite this at 100 mph because I like round numbers, and also because the A2 wind tunnel spreadsheet defaults to 100 mph. I’m still more comfortable talking about downforce in terms of (negative) coefficient of lift, but for the bulk of my audience who measures things in bananas and bald eagles, pounds of downforce is good.
But I also want to convert some of you to using coefficients, and also to using OptimumLap. So this blog post is my take on thinking in coefficients. (I’ll do a how to guide for OptimumLap in the future.)
Coefficient of drag
First let’s talk about the coefficient of drag (cD). Manufactures regularly publish drag numbers and I would guess that most car enthusiasts know that .20s is amazing (EVs), .30s is good (most cars), .40s is OK (SUVs), and .50s is terrible (trucks).
What people may not know is that manufacturer-supplied drag coefficients aren’t super accurate, because they cheat. They may adjust ride height and other things to achieve the best drag coefficient, so don’t take those numbers as gospel. Independent wind tunnel tests are perhaps better, but also not 100% accurate unless it has a rolling floor. Anyway, you can look up the drag coefficients of most cars (Ecomoder has a good list), and so I won’t spend a lot of time on that.
One thing I do want to mention is that you rarely see drag coefficients for cars with open windows. That’s how we track and race our cars in the USA, and it affects cars greatly. Every car is going to behave differently with open windows, so you’ll need to add somewhere between .03-.05 to your cD.
In my Veloster N, opening the front windows increased drag by 15%, and reduced rear downforce by 7%. The faster you go, the more aero balance shifts forward. This makes the car more prone to oversteer at high speed. In short, opening the windows is doubly bad for performance, so keep that in mind, as well as the drag penalty.
In the following table, the cars are all assumed to have closed windows except for the track car, which is a very rough estimate for a car with open windows and some aero bits added. I’ve listed pounds of drag and horsepower consumed by drag, just to give some hard numbers at 62 mph (100 kph). This is a rather low speed, but it comes up again when I examine coefficient of lift.
| Type | cD | Lbs @ 62 mph | HP @ 62 mph |
| EV | 0.25 | 110.72 | 8.55 |
| Commuter | 0.33 | 127.1 | 11.29 |
| SUV | 0.40 | 141.43 | 13.68 |
| Track car | 0.50 | 161.9 | 17.1 |
| Truck | 0.60 | 182.36 | 20.52 |
Coefficient of lift
While most people can wrap their heads around coefficient of drag (cD), they may have never seen values for coefficient of lift (cL). And that’s understandable, because manufactures seldom mention it. But they should! For going around a race track, cL is way, way more important than cD.
That’s because cars lift at speed, and most of that lift is over the rear. As the car goes faster and faster, it loses grip. If you want to go faster around a track, you need to reduce lift, or add downforce, which is essentially the same thing.
| Note that OptimumLap inverts the coefficient of lift. So if your car makes downforce, use a positive value; if it makes lift, use a negative value. |
So how much lift do most cars have? In the following sections I’ve divided cars into various groups based on their cL. These are general guidelines, to give you an understanding of how much lift or downforce typical cars have.
Low-drag cars (cL .20 )
A car that is streamlined for low drag usually has a lot of lift. The reason for that is the roofline is gradually curved and longer than the bottom of the car, so this creates low pressure above the car, creating lift. As such, most EVs have a lot of lift, but so do some sports cars that lack rear spoilers or wings.
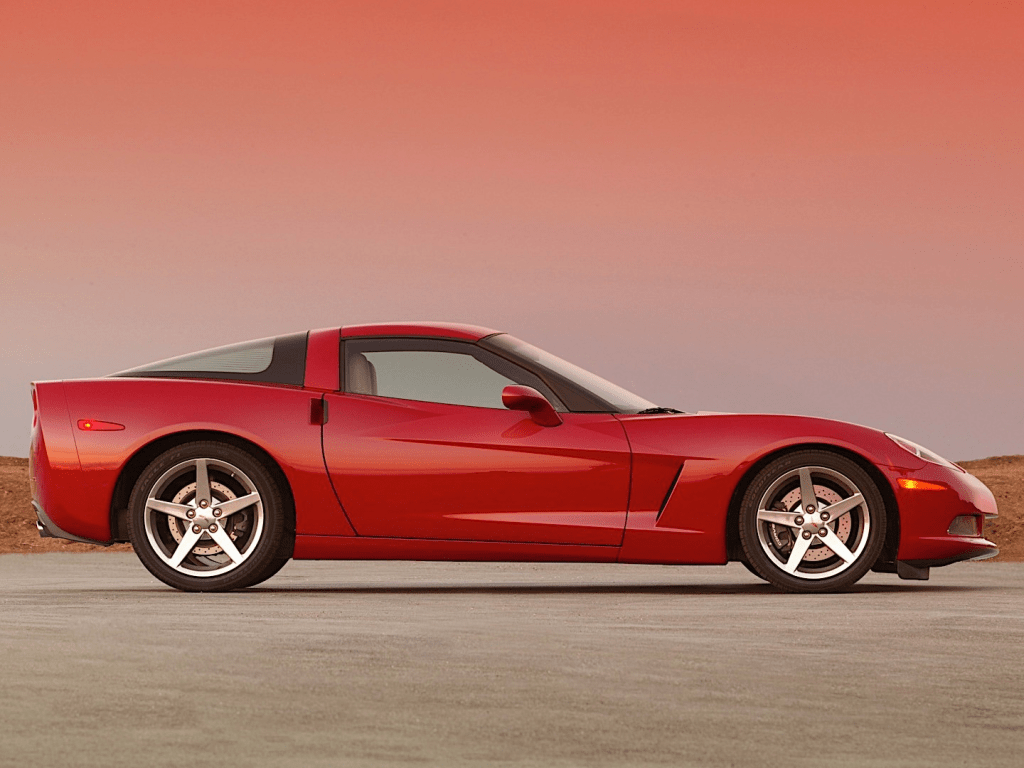
The C6 Corvette below, with a cL of .21, has significantly more lift than most cars.

Typical street cars (cL .15)
Most passenger cars have a cL of around .10 to .20, with the average somewhere around .15. I think I’ve written elsewhere on this site that the average was around .3, but now that I have more data, I see it’s about half that value.
The best sports sedans (BMW M3, Mercedes AMG models) are in the single digits, and some even get close to zero lift, but not quite.

Ideal balance (cL 0.0)
A car with a cL of zero over both axles is ideal; the handling doesn’t change at any speed. To do get that balance often requires a big spoiler or wing, to cancel out the lift, which is mostly in the rear. You won’t see those accoutrements on family sedans, and so this category (with a few exceptions) is for true sports cars.

Cars that have around zero lift include the Audi R8, Koenigsegg CCR, Nissan GTR, and Pagani Zonda F, as well as most Ferraris and Porsches. You don’t really see many sedans that achieve zero lift, but oddly I know of two hatchbacks that do, the Ford Focus RS and Hyundai Veloster N.

Supercars (cL to -0.3)
There aren’t many production cars that have a cL in the negatives, and the ones that do are supercars. Dodge Viper SRT 10, Ford GT, Honda NSX-R, Mercedes MacLaren SLR, and Porsche 997 GT3, to name a few, and also most cars from Lotus.

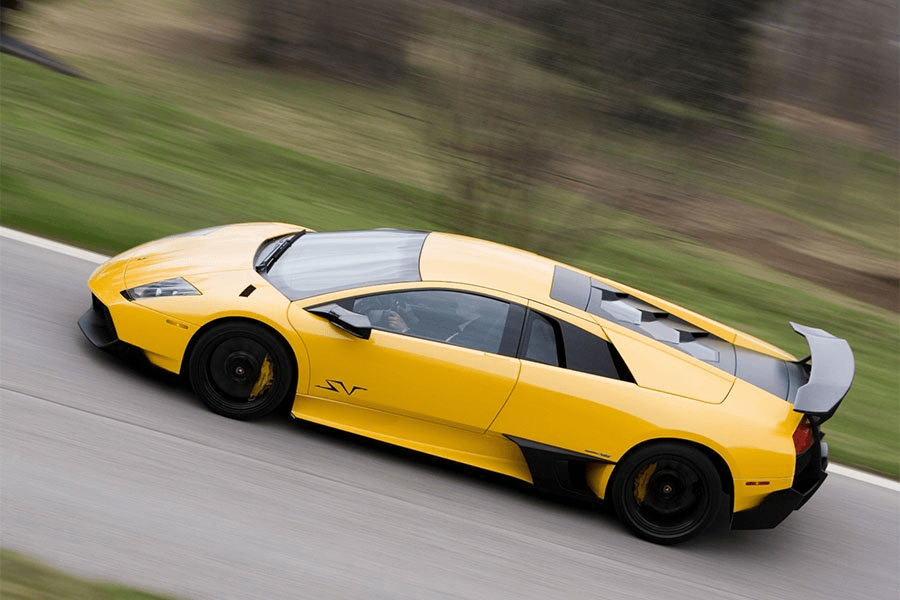
The production car with the most downforce (that I have data on) is the Lamborghini Murcielago L670-4 SV.

Production cars end at around cL -.3, but this is where proper race cars begin. I don’t have numbers for the latest hypercars, like the Aston Martin Valkyrie, but that surely produces race car downforce.
DIY track cars, race cars with spoilers (cL -0.5)
Many DIY track cars with splitters and wings have a cL approaching -0.5. They should be better than that, but are limited by the average builder’s understanding of aerodynamics and average level of execution. Professional race cars with airdams and spoilers also come in around this number.
For example, NASCAR stock cars circa 2002 had a cL of -.46. These cars make look crude, but are highly developed aerodynamic missiles. This is about as good as you can do with an airdam and spoiler.

Another race car with a spoiler was the 1990 RX-7 GTO, which had a cL of -.44. The Mazda looks really slippery, but it doesn’t achieve the same level of aero as a stock car. The interesting thing about the RX-7 was they ran it with both a wing and a spoiler.

My Hyundai Veloster N with the a flat splitter (3″ lip, 4.5″ height) and a big ducktail spoiler tested at a cL of -.43. I guess Hyundai got a few things right, because I was going for the crudest aero I could and somehow landed next to some pro race cars with spoilers.
Winged track cars (cL -.5 to -1.0)
To get better than cL -0.5, you pretty much need a wing or underbody aero. Let’s start with the RX-7 with a spoiler and see what happens when they swapped to a wing. Drag decreased from cD .51 to .48, and lift went from cL -.44 to -.53. That’s a big difference in both directions, and resulted in a 128% increase in aerodynamic efficiency (more on that later). I don’t know if the rules limited wing height, but mounting the wing higher would probably increase downforce even more. In any case, the wing bumped the car above cL -0.5, which is where most race cars with wings reside.

Another car with a similar cL was a GT2 car used in a scientific paper (pdf), which had a cL -0.5. Interestingly, the majority of downforce (85%) was from the rear wing, and it seems like they should have been able get more front downforce to balance that out. But GT2 is a highly regulated class, and so maybe there’s nothing they can do within those rules.
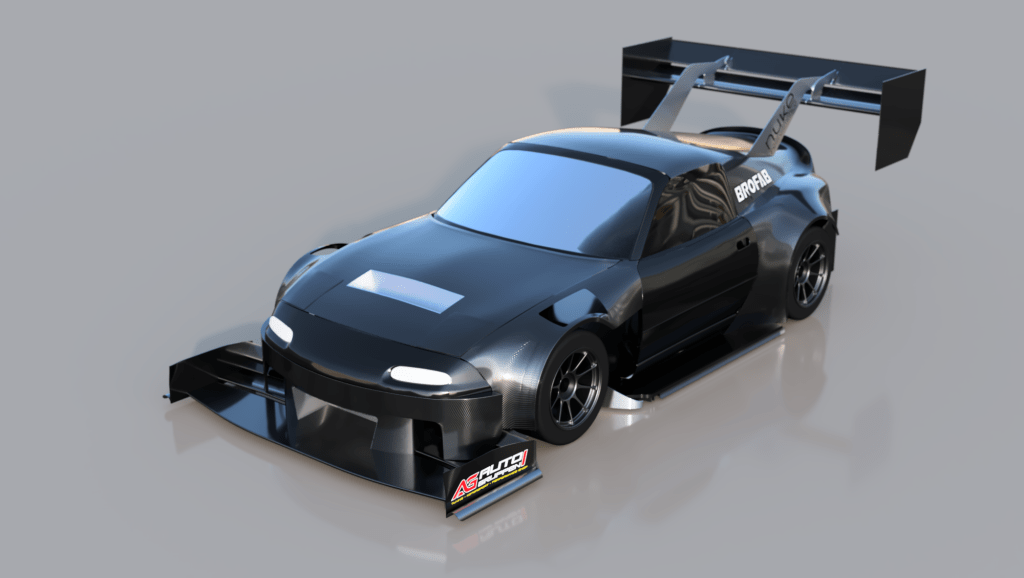
Most Miatas with an airdam, splitter, and wing will also be in this range. The 9 Lives Racing medium downforce kit typifies this build. I don’t trust CFD until it’s been validated in a wind tunnel, but these do seem like reasonable numbers.

My Hyundai Veloster N outfitted with a DIY splitter, canards, and wing also made its way into this category, with a wind-tunnel tested cL of -.68. The wing was rather short at 135cm (53″), and I didn’t optimize the angle or height (I was testing many other things). I also had the splitter at 4.5″ ground clearance, which was too high. But even if I had a chance to lower the splitter and optimize the wing, I’m not sure the car would break the cL -1.0 barrier. That’s serious race car territory.
Serious race cars (cL -1.0 to -2.0)
The average car enthusiast building a track car is going to have a difficult time getting below cL -1.0. To get into this category requires careful attention to details that the average DIY builder doesn’t know or care about.
Still, it can be done, and my fastback Miata with various tricks managed cL -1.2 as tested at Watkins Glen.

Prototypes (cL -2.0 and less)
Any car that achieves a cL of less than -2.0 is likely a pro-level race car or a time attack build. It’s just very difficult to achieve this level of downforce. Katz cites a generic prototype racer at cL -3.0. The Audi R8 Lemans racer was around cL -2.6. At the top of my list is a Mazda RX-792P that was reported to be around cL -3.8.

Time attack cars don’t race wheel-to-wheel, and so their aerodynamic parts can be wider than the car. I’m quite sure these cars are well under cL -2.0.

It’s also possible to achieve a cL of under -2 by sucking the car to the ground with a huge fan. The Gordon Murray T.50 does just that, and has a cL in the -2.2 range.

The following table is based on a car with 2 meters of frontal area (21.53 square feet) and different cL values representing various cars. I chose a speed of 62 mph (100 kph) as OptimumLaps lists this in its vehicle report. It’s also a sensible cornering speed, and about where aero feels like it’s working. (Aero is always working, but this is around the speed where people feel it working.) The downforce value in the table is the cL inverted, which is how you’d put them into OptimumLap.
| Type | Downforce | Lbs @ 62 mph |
| Sedan | -0.15 | -31 |
| Sports | 0 | 0 |
| Hypercar | 0.25 | 51 |
| NASCAR | 0.45 | 92 |
| Track | 0.8 | 164 |
| Race | 1.3 | 266 |
| Time attack | 2.2 | 450 |
| Prototype | 3 | 614 |
Lift/Drag ratio
I started by discussing drag and then moved onto lift, so now let’s divide lift by drag to get the L/D ratio. The L/D ratio tells you how effective the car is at making downforce, and it’s often referred to as aerodynamic efficiency.
If this is a positive value, then the car makes lift, and the bigger the number, the worse it is. Most street cars and Spec race cars (Spec Miata, SE46, 944 Spec, etc) have a positive L/D ratio. Any car with a negative L/D ratio makes downforce, and the mo negative, the mo better.
In the following sections, I sort cars into rough categories that represent different L/D ratios. I’ll ignore anything that doesn’t make downforce. Fuck those cars.
DIY track cars (-1:1)
Cars with a L/D ratio of negative one to one make as much drag as they do downforce. Most track cars with DIY splitters and wings are somewhere in this range with a cD 0.5 and a cL -0.5. Add canards and it might be cD 0.6 and cL -0.6. Add a dual element wing and it might be cD 0.7 and cL -0.7. You see where I’m going with this, as long as the drag and downforce values are about the same, the car is in this category of mediocre aero efficiency.
My Hyundai Veloster N with a ducktail spoiler, better splitter, and some aero tricks thrown at it was about -1:1.

Race and TT aero (-2:1)
Any car that achieves a L/D ratio of -2:1 or better I’m going to put into the very generalized category of race aero. It’s difficult for a typical home builder to achieve this for a number of reasons. One of which is that in the USA we have to run with the windows down, and this adds drag and reduces rear downforce, making it even harder to achieve aero efficiency. But it can be done if you know what you’re doing, especially if you consult a professional or talk to Kyle Forster.
I don’t have a lot of data on time attack cars, but because they are usually unbound by engine restrictions, they make enormous amounts of power. As such, they can get away with adding downforce and mostly ignoring drag. I would imagine a lot of time attack cars are in this 2:1 category as well.

Professional aero (-3:1)
To get a L/D ratio of -3:1 you need to obsess about drag, and choose aero components that return a high L/D ratio. No, I’m not talking about choosing a wing for its efficiency, please stop with that nonsense. I’m talking about choosing components that give the entire vehicle the best aerodynamic efficiency (often this is running wing angle that’s close to stalling).
I don’t think you can get to this level without a lot of research and testing, and by that I mean a combination of CFD, wind tunnel, and track testing. I’m sure there will be a lot of time spent managing and manipulating vortices.
This is the level I’m trying to reach with my race car. I’m purposely not putting an image of a car here, because I’m reserving that for Falconet, after I come back from the wind tunnel and figure out how to squeak over the line with a L/D of -3:1
Prototype aero (-4:1)
It’s difficult to achieve this level of aero efficiency, but it can be done, or even exceeded. In fact, Le Mans prototype cars are limited to L/D of 4.0, so you know that it’s possible to do better than that. But you or me? Nah.
